
.png)
Understanding the dynamics of businesses within your market is essential for effective retail planning and economic development. Placer provides insights into top-visited places by various audience segments, identifies areas of retail leakage, and allows you to anticipate the impact of planned developments. This article will guide you through utilizing specific reports within the platform to analyze business performance, uncover growth opportunities, and forecast market trends.
You’ll be able to answer these questions after reading this article:
- How can you identify top-visited places by residents, commuters, and visitors to improve retail recruitment?
- How do you perform a retail leakage analysis on your market?
- How can you view planned development data to forecast upcoming changes in your market?
Pro Tip: The reports and widgets available in the Markets section may vary per account.
Get started with the following steps:
Step 1: See your market’s top-visited places by residents, employees, and visitors to improve retail recruitment
By analyzing the frequented locations of different audience segments, communities can identify gaps in their retail landscape and target businesses that align with local demand.
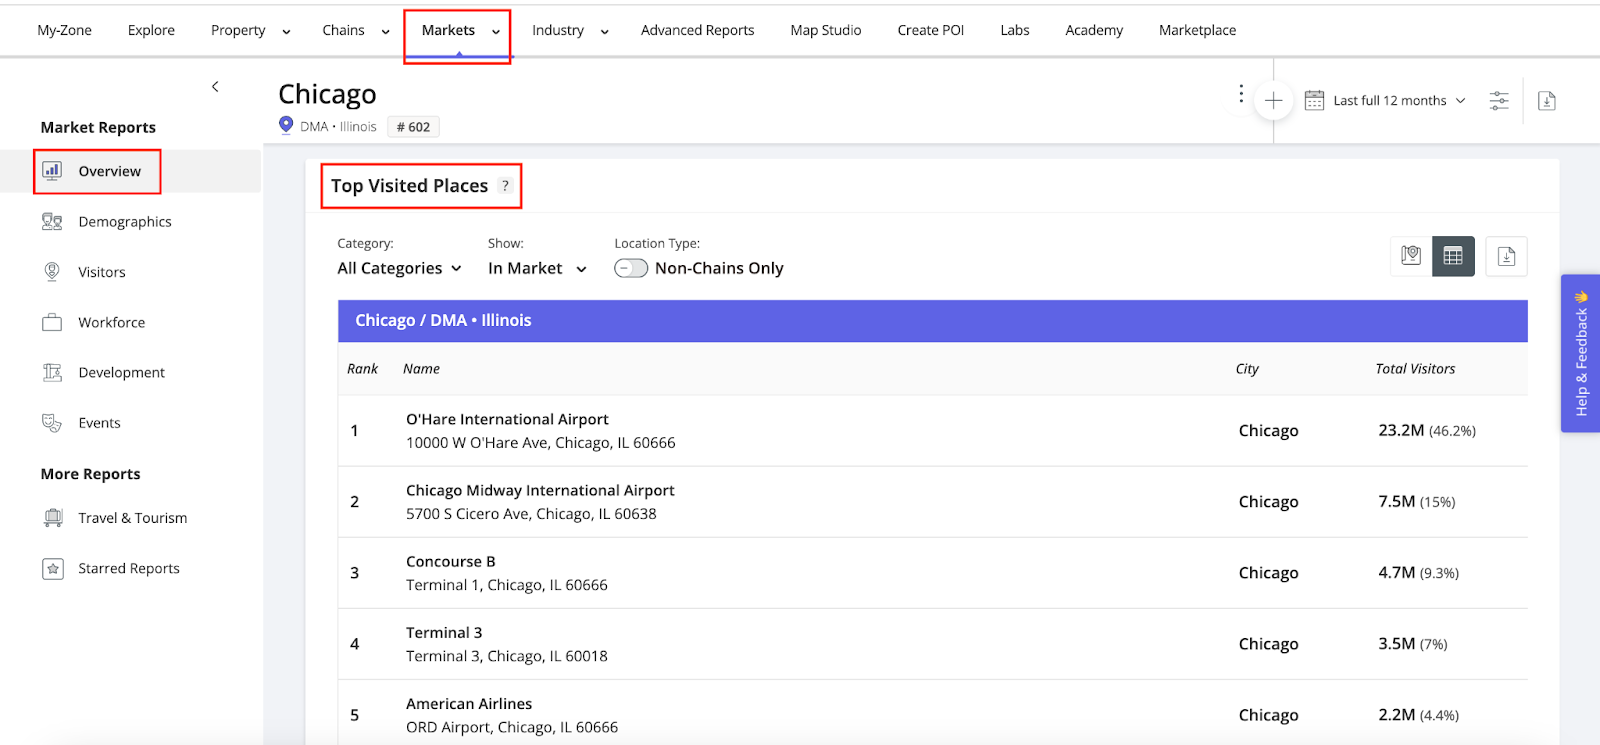
a. In the top navigation bar, select the Markets section to run a report for a market of interest, then navigate to Overview in the left sidebar.
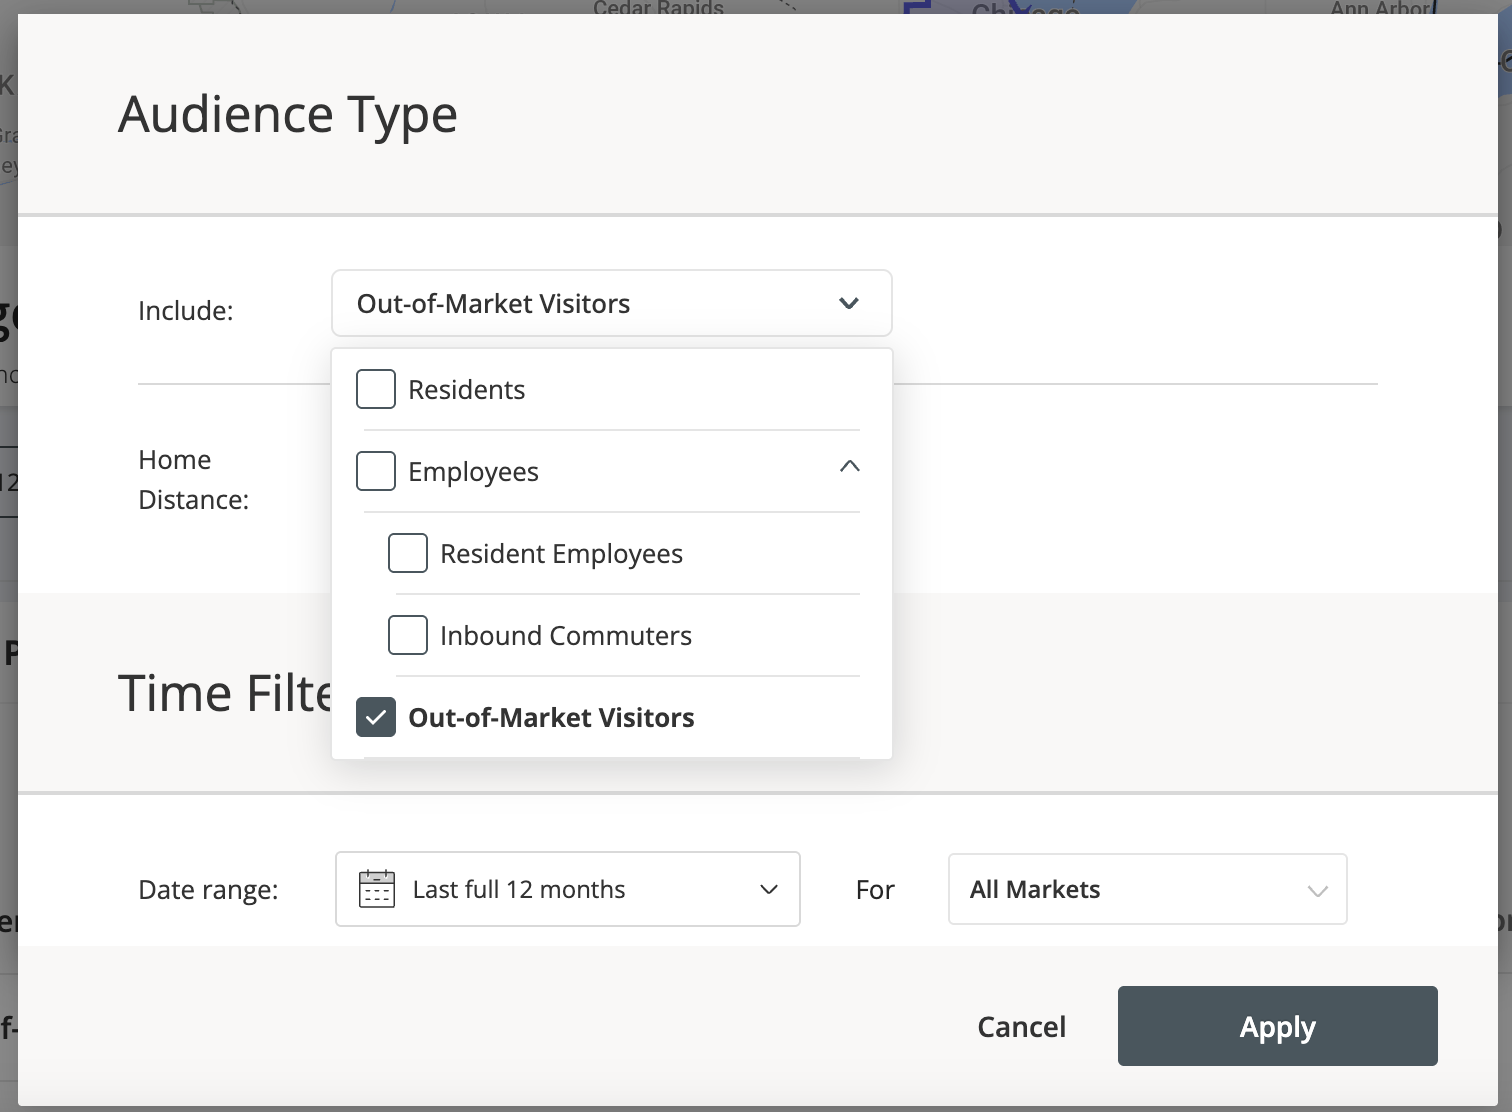
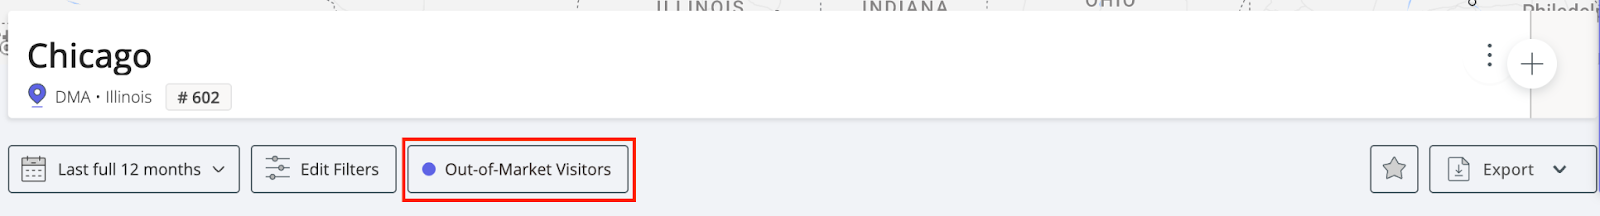
b. Choose your desired audience segment at the top of the page by clicking Add Filters. Here you can select all segments or select a specific audience to focus on. In this example, we’ll focus on Out-of-Market Visitors.

c. Scroll to the Top Visited Places widget to identify the most frequented locations in the market for the selected audience segment within the chosen date range.
d. Refine your analysis by applying filters (category, in/out of market locations, and location type) to focus on the most relevant locations. Understanding where visitors spend their time—both within and outside your market—helps identify gaps in local offerings and uncover emerging business trends that draw customers elsewhere.
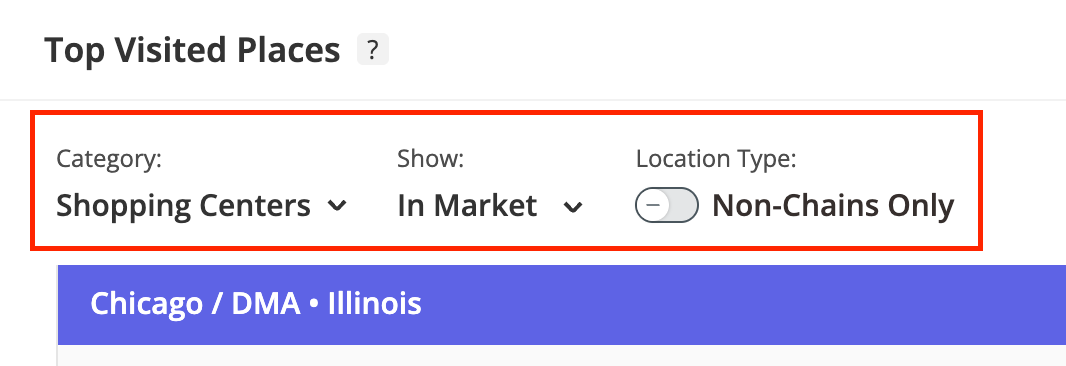
Pro Tip: Filtering Top Visited Places to show only "Out of Market" locations automatically focuses the report on the "Residents" audience segment. This effectively provides a retail leakage analysis, revealing where local consumers are shopping outside your market.
Step 2: Perform a retail leakage analysis on your market
A market may experience retail leakage due to strong competition in neighboring communities or unmet demand within the local market. You can request a Retail Leakage XTRA Report for deeper insights into local spending habits, revealing the categories and specific stores residents visit outside their home market. These insights help identify gaps in local retail offerings and uncover opportunities to meet unmet demand within your community.
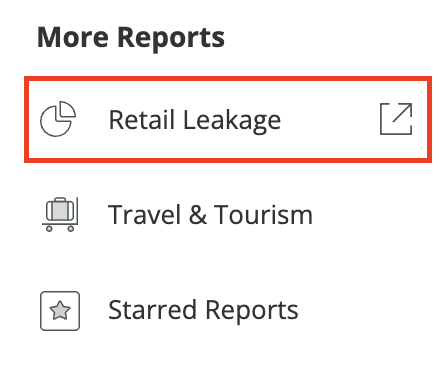
a. Under More Reports, select Retail Leakage to view the XTRA report.
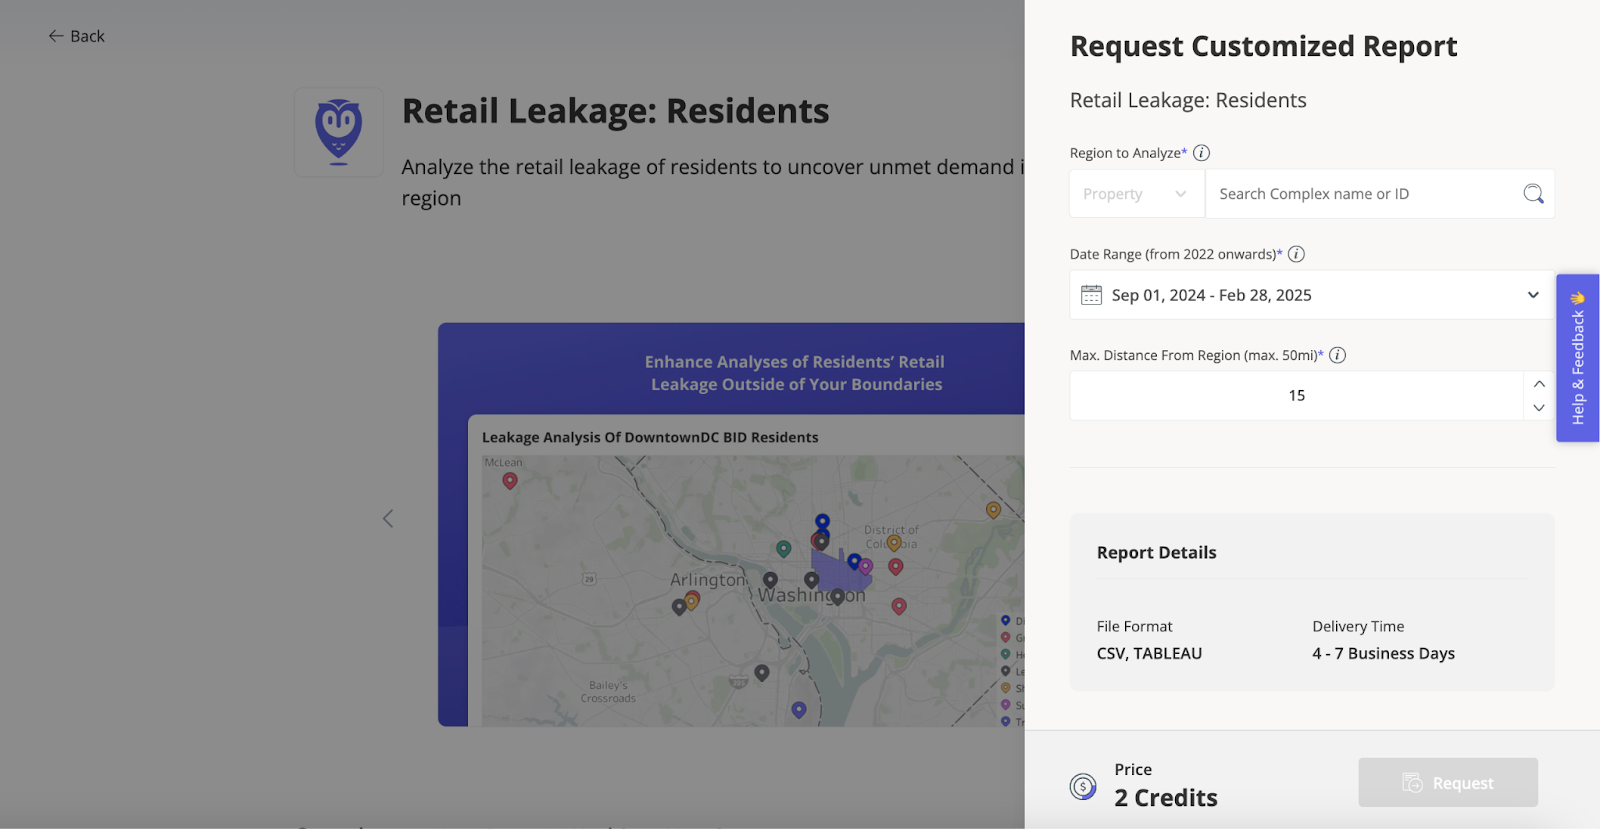
b. To request this report, enter your market of interest and select the applicable date range and mile radius you’d like to use. Once submitted, this report is delivered in 2-4 business days.
Learn about Placer XTRA
Step 3: For those who have the Development Report, use planned development to forecast what is coming in your Market
Planned and ongoing development data can be instrumental in effective municipal planning. Find information on projects at their various construction stages within a specific neighborhood, and visualize changes in the retail landscape with a map that highlights recent store openings and closures.
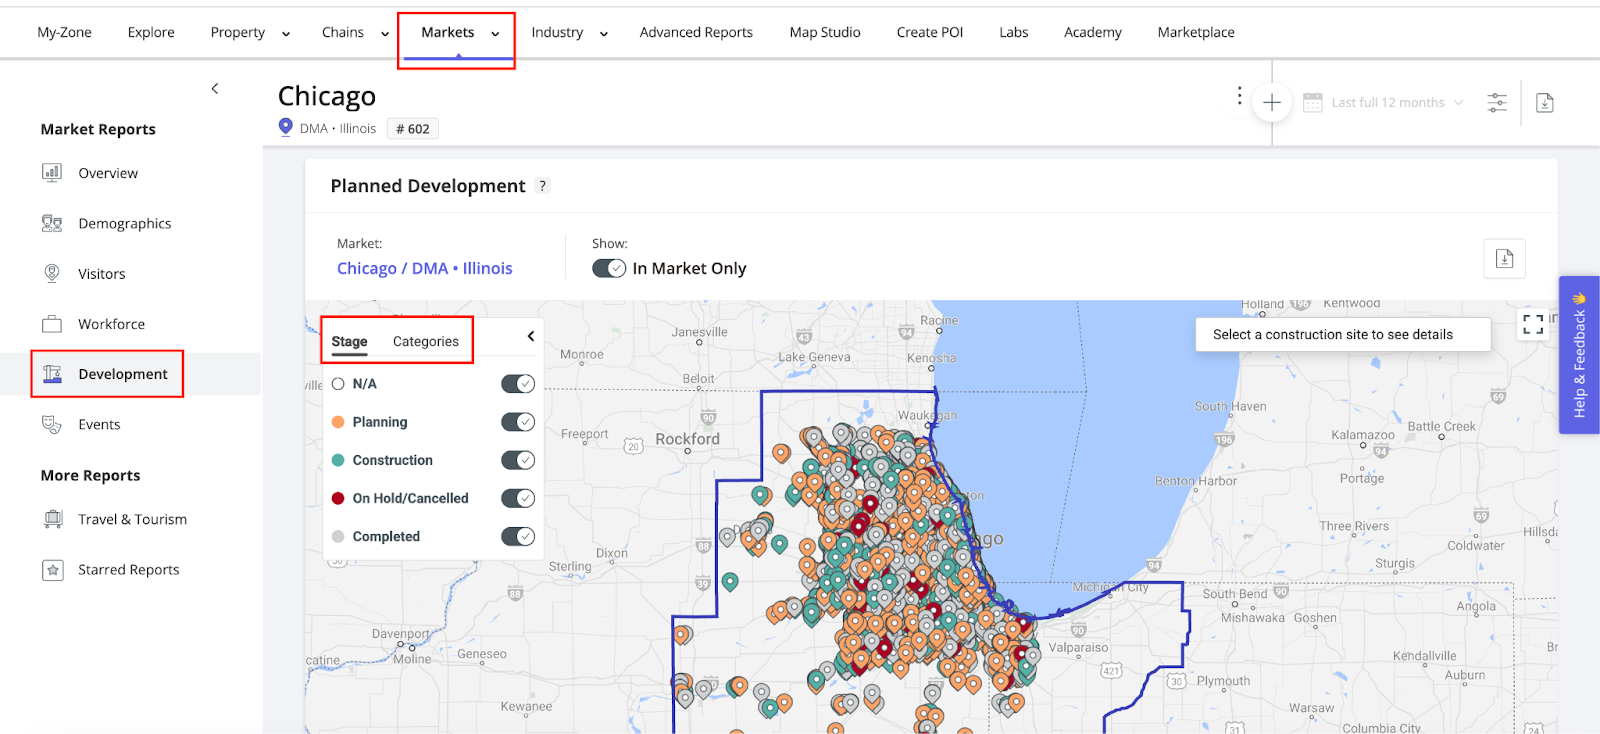
a. Navigate to the Development report in the left sidebar.
b. Scroll to the Planned Development widget to explore projects at various stages of construction and evaluate the surrounding area’s future commercial potential. Refine the analysis using the following parameters:
- Stage - Displays development projects according to their stage of construction (Planning, On Hold/Canceled, Completed). Property pins are color-coded according to their construction stage to help you examine properties in the same stage of construction.
- Categories - Shows development projects by their property category (Retail, Hotels, etc.).
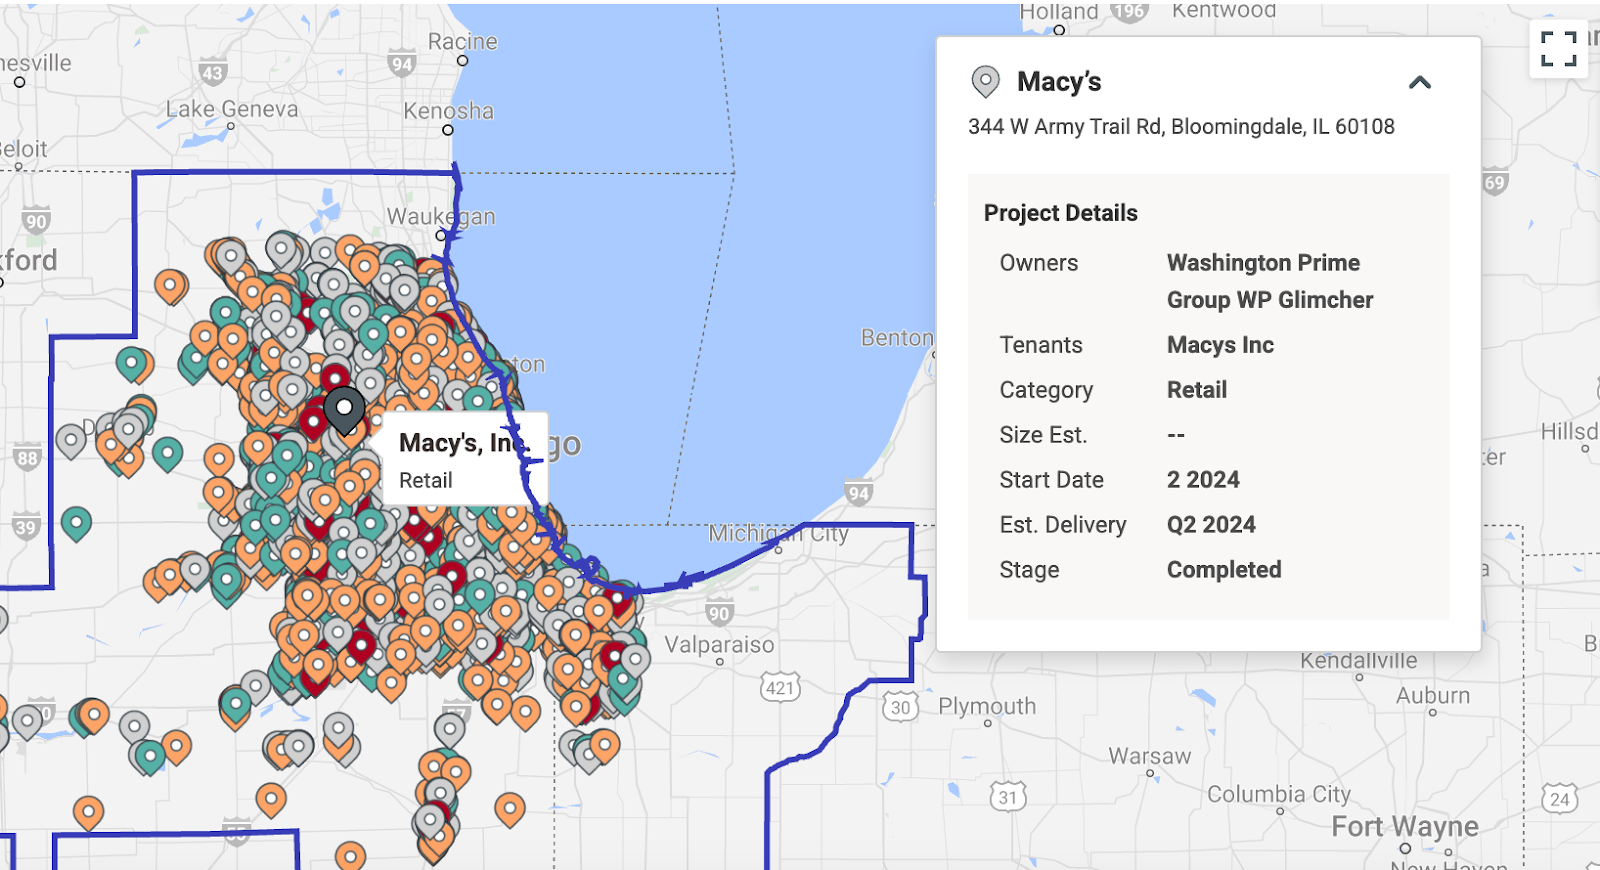
c. When selecting a development project on the map (any pin), you will see additional information on the selected planned project, including its name, address, owners, and size.
Pro Tip: The data in this widget is from a 3rd party provider called BCI BuildCentral. The dataset contains information on construction projects of grocery chains and other retail venues, and is updated by BCI on a weekly basis. Please note that there is a lag time for data flowing in this widget due to BCI’s project verification process, which ensures the validity of the information displayed.