
.jpg)
"Day parts"Different segments of the day, such as lunch hours or happy hours. offer unique opportunities and challenges for dining businesses due to fluctuating customer traffic and varying needs. Placer helps you analyze and compare day-part visitation to understand where you can optimize operations, menu offerings, and staffing to maximize profitability.
After reading this article, you’ll be able to answer:
- How many visits do I have compared to my competitors, by time of day?
- Who holds the largest percentage of the market, by time of day?
You may want to conduct this analysis for specific locations (option 1) or multiple brands in a particular region (option 2). Scroll down to the section most relevant for you:
OPTION 1: Analyzing Competitor Locations
Step 1: Analyzing visits by hour
a. Open the Property section and search for your location, as well as your top competitor locations (you can view up to 8 at once).
To determine who your top competitors are, follow this guide.

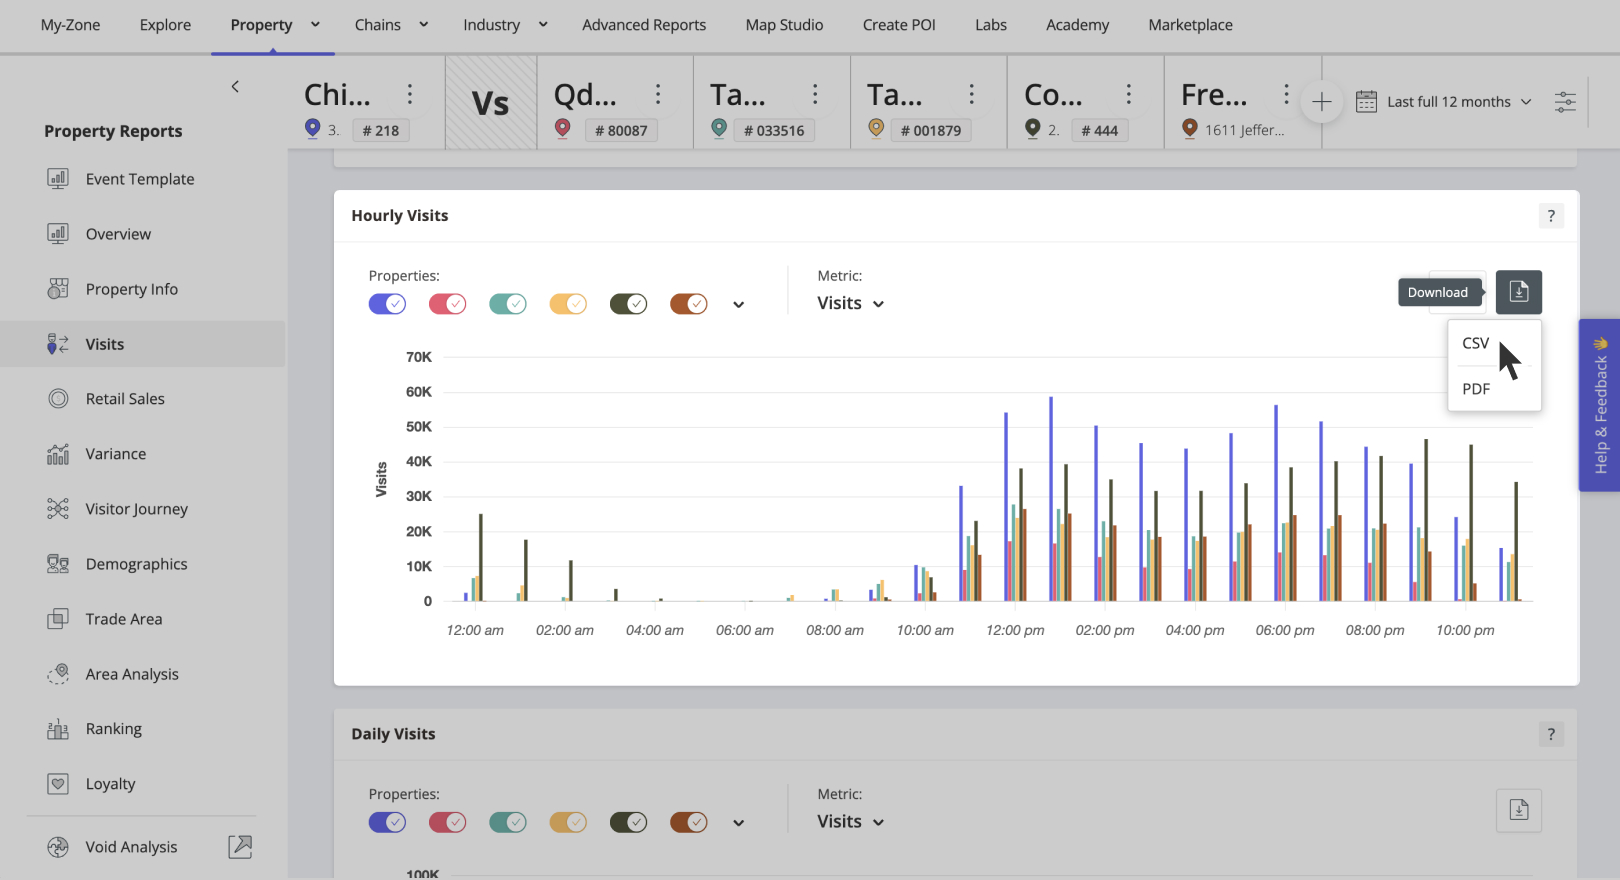
b. Go to Visits and scroll down to Hourly Visits. Here you can see how you compare in terms of visits to your competitors by each hour of the day.

Step 2: Calculating visit share by hour
a. If you’d like to understand your exact visit share, by time of day, download this chart as a CSV.
b. Add a “Total” column that sums up visits for all of the locations for each hour of the day.

c. Add another column for each location and divide its visits by the total number of visits during that hour. This will show you each location’s visit share by hour.

OPTION 2: Analyzing Competitor Brands
Step 1: Identifying your competitors
a. If you already have a list of competitors that you’d like to compare yourself to, you can skip to Step 2. If not, open the Industry section and search for the category you belong to, as well as the region that you’re interested in analyzing (it can be a CBSA, DMA, State, or Nationwide).

b. Scroll down to Ranked Chains and you’ll find your top competitors, based on visits, in your area. Decide which of these brands you’d like to analyze in the next step.

Step 2: Analyzing visits by hour
a. Open the Chains section and search for your brand, as well as your competitor brands, in the region that you’re interested in.

b. Scroll down to Hourly Visits. Here you can see how you compare in terms of visits to your competitors by each hour of the day.

Step 3: Calculating visit share by hour
a. If you’d like to understand your exact visit share, by time of day, download this chart as a CSV.

b. Add a “Total” column that sums up visits for all of the chains for each hour of the day.

c. Add another column for each chain and divide its visits by the total number of visits during that hour. This will show you each brand’s visit share by hour.
