
%20(1).jpg)
Consumer regional demand may shift over time due to factors such as consumer trends, economic impact, or merely changes in the amount of population within the area. With Placer, analyze migration patterns by region, dive into the demographic changes, and understand the impact on local consumer demand.
You’ll be able to answer these questions after reading this article:
- How can you see a nationwide analysis of domestic migration patterns?
- How can you analyze changes in demographic factors that shape local consumer demand, such as age, household income, or marital status?
- How can you view population trends in your trade areas, now and in years to come?
Pro Tip: For customers who have purchased Placer’s Migration Trends Report, follow the next steps to gain insights into population movement in the US. The Migration Trends report presents visually and interactively the destinations to which the U.S. population migrated, and the regions they left, revealing macro trends and associated demographic factors that shape local communities and consumer demand. For more information on Migration Trends Report or to request pricing information, click here.
Get started with the following steps:
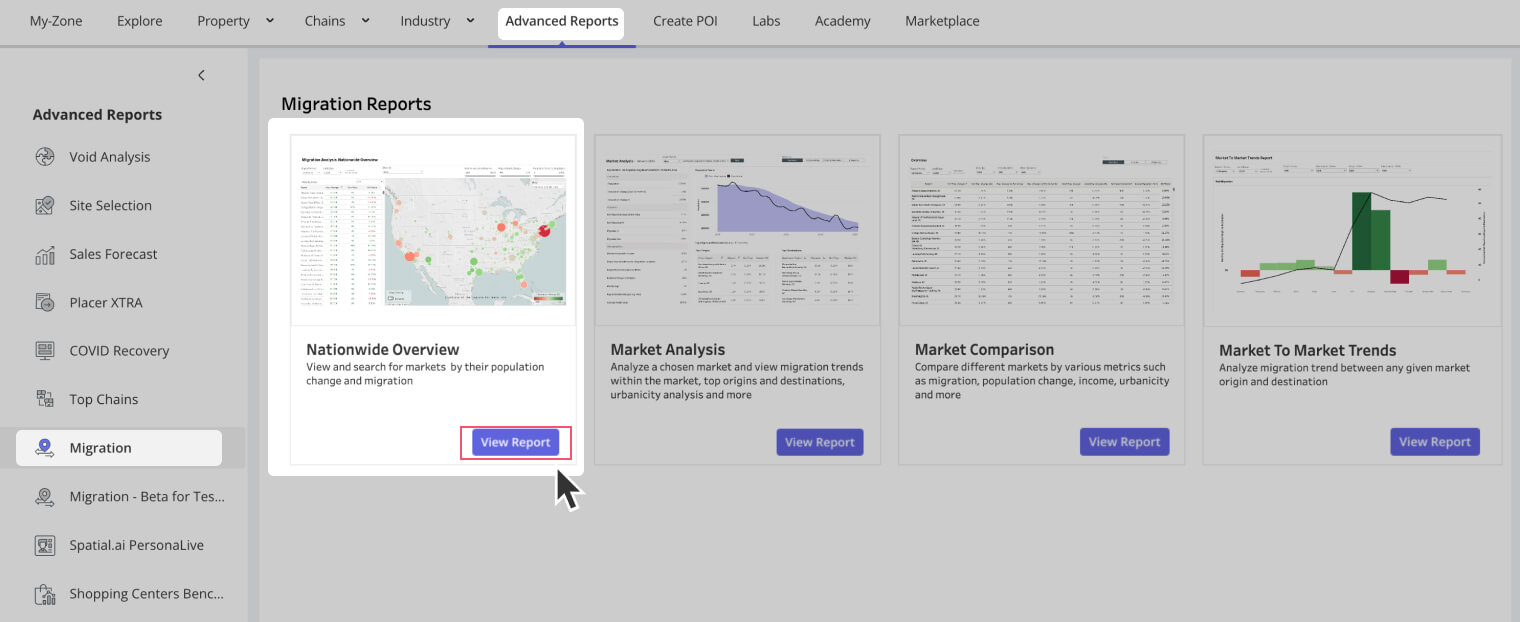
Step 1: Use the Migration - Nationwide Overview report to explore population flows at the state, county, or CBSA level
a. Go to Advanced Reports, select Migration in the left sidebar, and click the Nationwide Overview report.
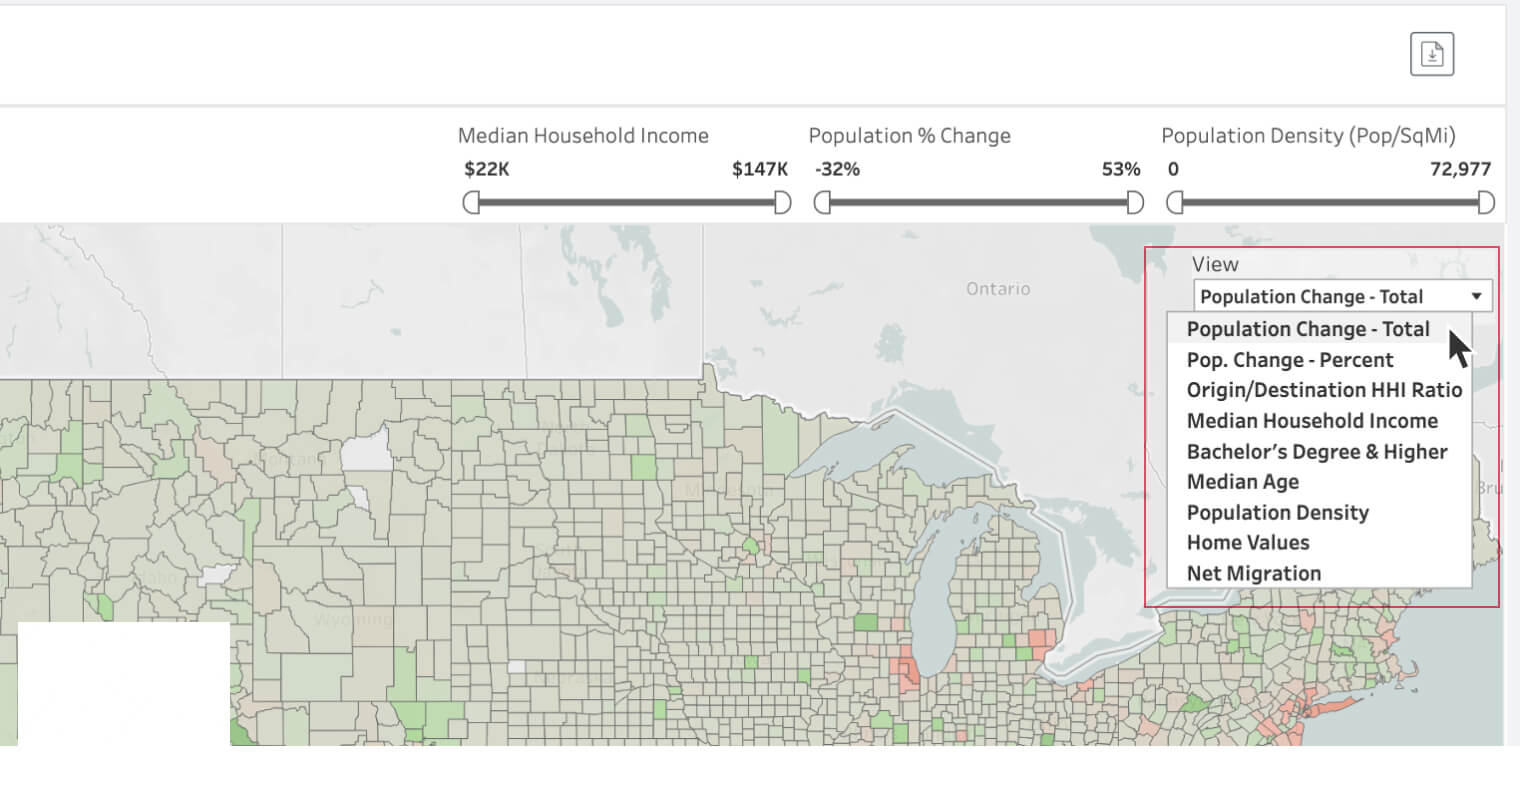
b. Select the relevant time period and map visualization by region (County, CBSA, or State).

c. Using the dropdown, select what population metrics to visualize on the map, for example - education level, % population change, household income, age, and more.
d. Filter the results by different demographic parameters to focus on regions with specific criteria.
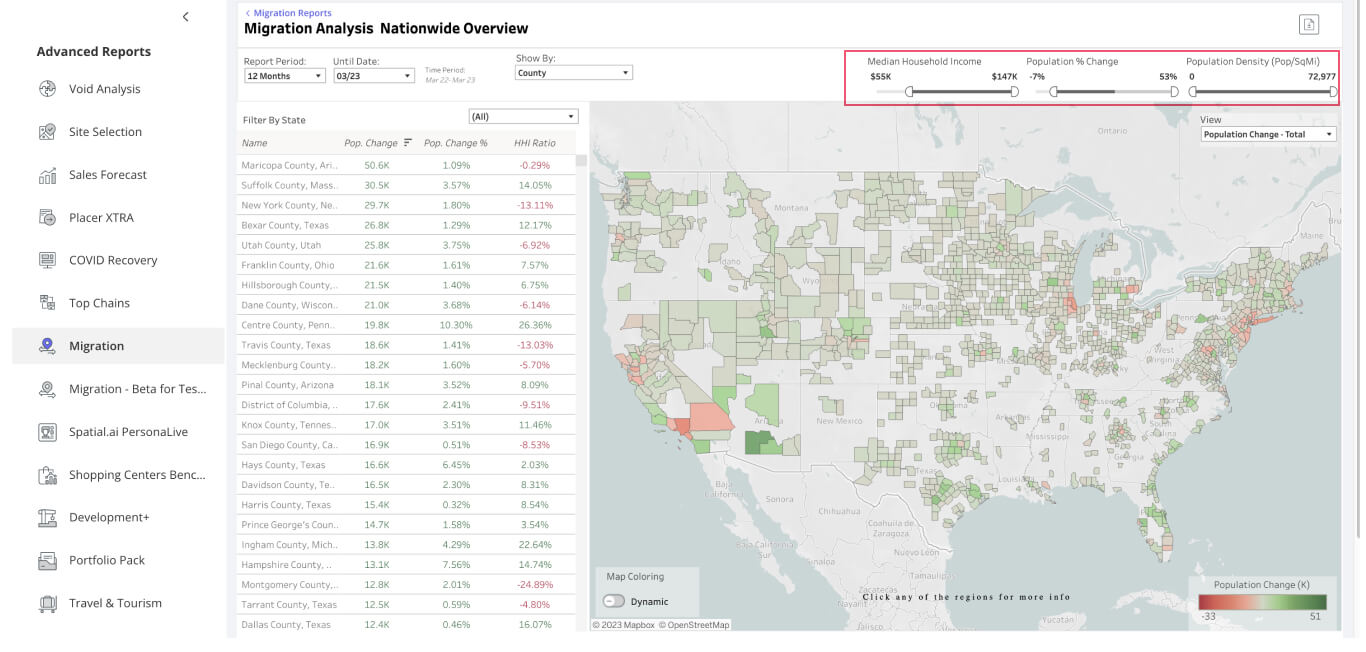
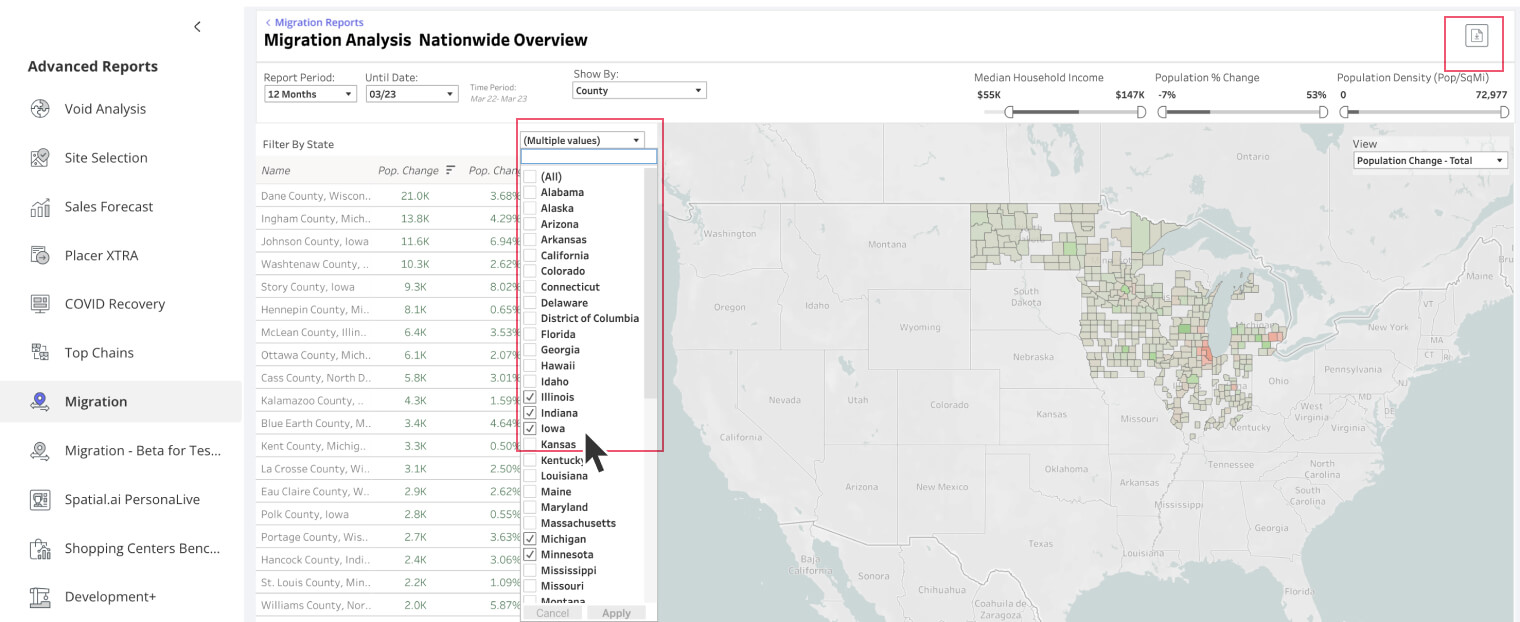
e. Choose the specific states you want to focus on from the list and click Apply. You can then export the data as an Excel or CSV file for further analysis.
Step 2: Use the Market Comparison report to easily compare different markets by various metrics
a. Navigate to Advanced Reports, select Migration in the left sidebar, and click the Market Comparison report.

b. Select your desired timeframe, choose which type of region should be presented in the table, and further filter by state, CBSA, or county.

c. Change report type to Urbanicity to dive into migration trends broken down by urban, suburban, or rural areas. You can export data as an Excel or CSV file for further analysis.