
.jpg)
The performance of different retail players can be fully understood only when analyzed in the wider context of the entire retail market. Placer helps manufacturers and suppliers understand the competitive position of retail chains and provides accurate benchmarking metrics against competitors and the entire category.
You’ll be able to answer these questions after reading this article:
- What are the top performing chains by category in different regions?
- Are there chains that over or under-perform in specific sub markets?
- What are the top performing stores within each chain and how do they compare to different benchmarks?
If you’re looking to learn how to review industry trends in your market of interest, read this article.
Get started with the following steps:
Step 1: Understand chains’ competitive position in the industry
a. Open the Industry section and search your category of interest. Industry metrics are available nationwide and also by state, CBSA, or DMA. To compare different categories or regions, you may add up to 8 different categories to the report.
b. In the Overview report, Scroll down to Ranked Chains and see a list of all chains ranked in order of highest to lowest foot traffic for the timeframe selected. This is helpful in understanding the nuances of national chains’ competitive position within local markets.
.jpg)
c. Go to the Variance report and scroll down to Variance List. This report shows the performance variance within each industry and region down to the chain level, compared to previous time frames. In this example, we examine the foot traffic performance of grocery chains in the Charlotte DMA, April 23’ compared to April 21’. We can see a considerable increase in foot traffic for several chains. Clicking each chain will open the relevant Chain report in a new tab.
Step 2: Identify the top performing stores within entire retail chains or specific regions
a. Go to the Chains section and type your chain and region of choice at the top search bar.
b. Scroll down to Ranked Venues and see a list of the chain’s locations ranked in order of highest to lowest foot traffic for the timeframe selected. The list can be filtered to display stores in specific states, or ranking based on weekly/ monthly aggregations. Clicking each store will open a Property report.
c. Go to the Variance report and scroll down to Variance List. Here you can see the performance variance within the chain down to the store level, compared to previous time frames. Clicking each store will open the relevant Prepoerty report.
Step 3: Research the competitive position of individual stores
a. Select your store of interest from the Chain Report to open the relevant Property report. Then, select the Ranking report. The Ranking report helps evaluate store’s performance in a wider context, as it allows to benchmark stores not only against all chain locations, but also industry and regional comparators.
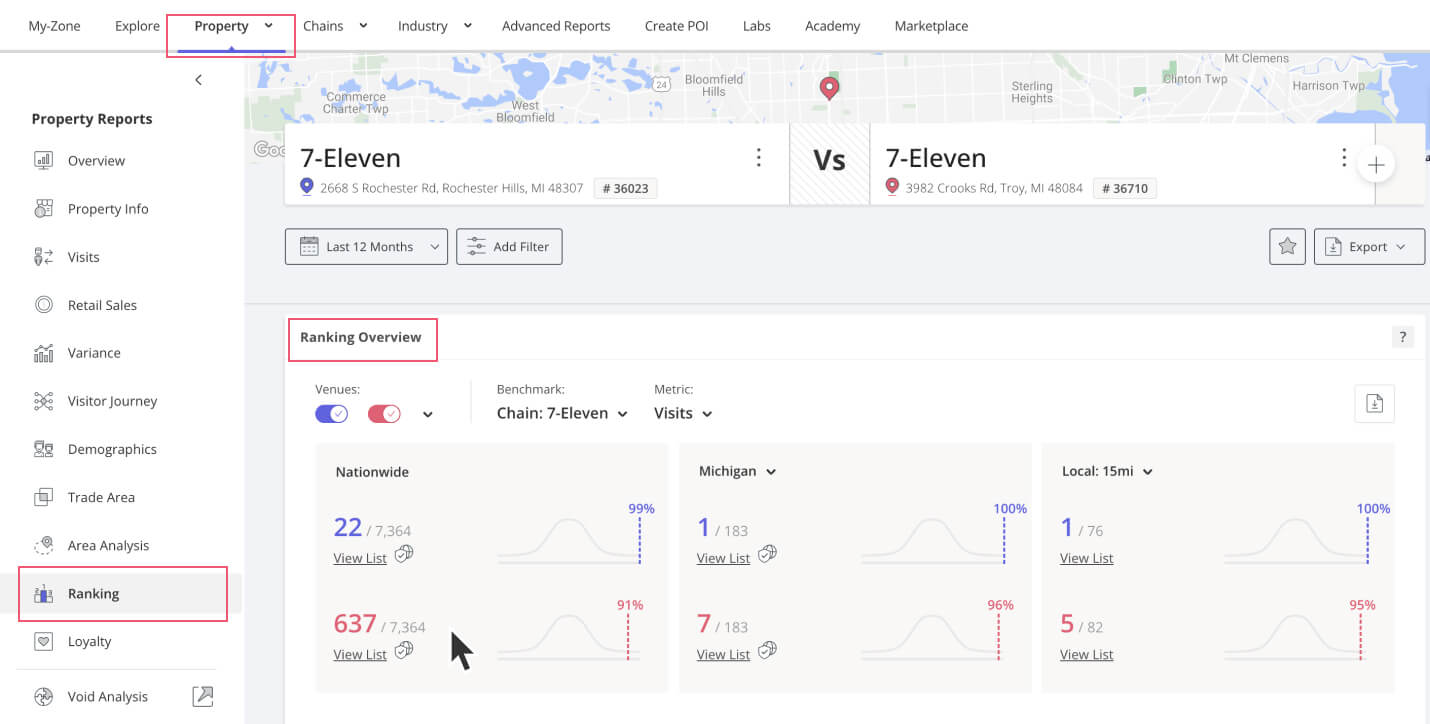
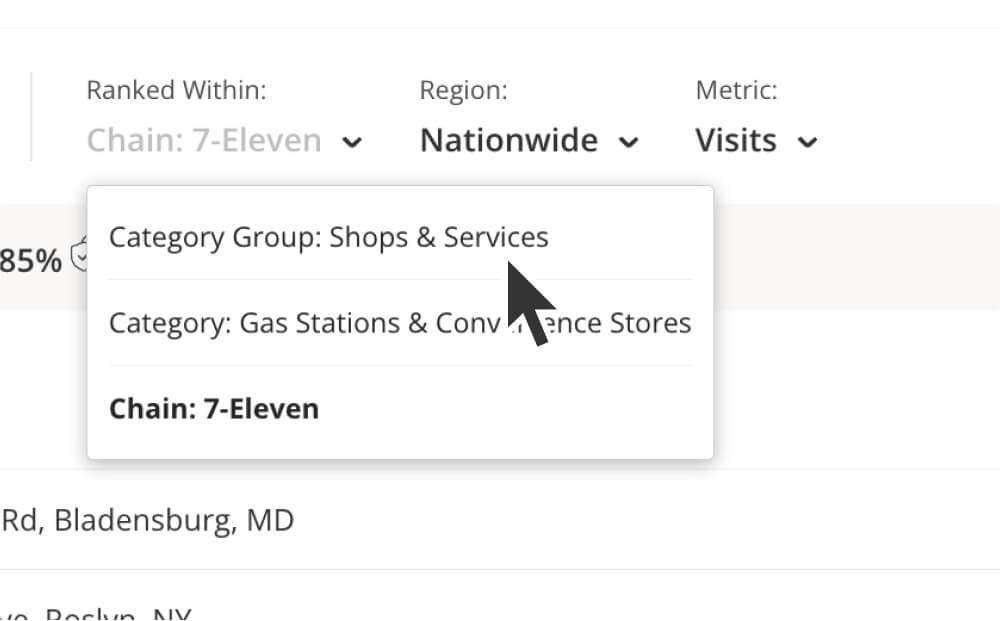
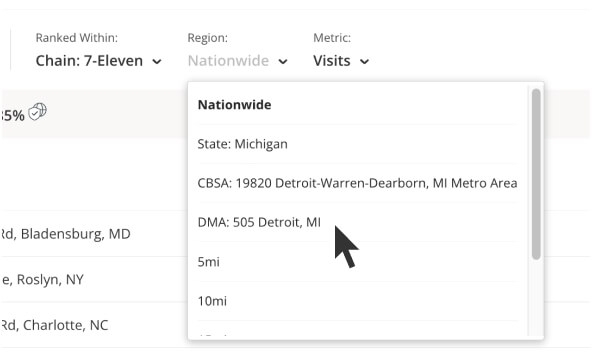
b. In Ranking Overview, benchmark the store against the category, category group, or within the chain. Analyze ranking based on different metrics, and see how the store performs compared to different regional benchmarks. To see the full list of stores within each benchmark, select View List. This list can be laid out on a map and exported for further analysis.
c. In Percentile Rank, a histogram view allows you to understand how unique or common is the performance of the store compared to all stores within the chain or category.
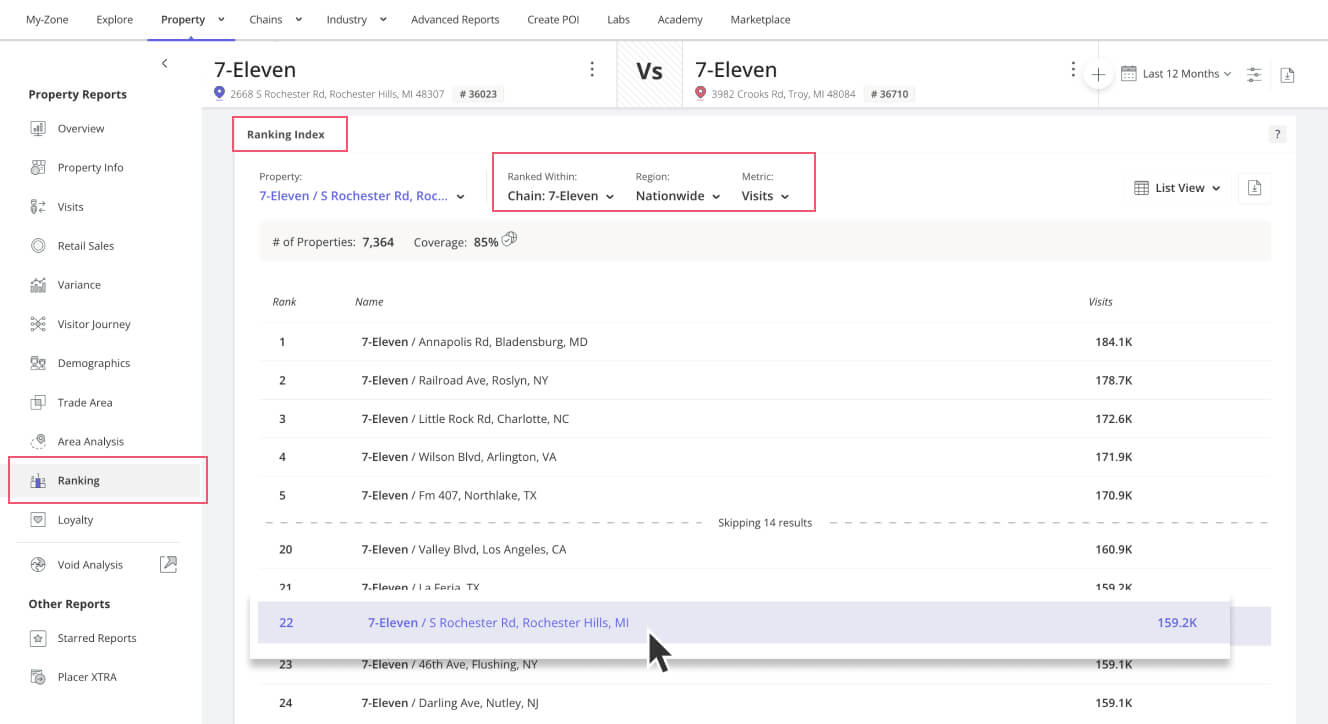
d. Scroll down to Ranking Index to view a full ranked list of stores within the chain, category and region. Clicking each store will open the relevant Prepoerty report.
Learn more about analyzing individual stores