
.jpg)
Centers need to measure and report their success. Use Placer to highlight your center’s strengths by showing center reach and visitor draw, and underscoring the value of existing tenants. Analyze visitation data and compare it to competitors, analyze trade areas, and rank your center and tenants.
You’ll be able to answer these questions after reading this article:
- How can you compare your center’s visitation data to a competing property?
- How do you analyze trade areas to understand reach and visitor draw?
- How can you evaluate the performance of your center and an existing tenant?
Get started with the following steps:
Step 1: Analyze visitation data and compare it to competitors
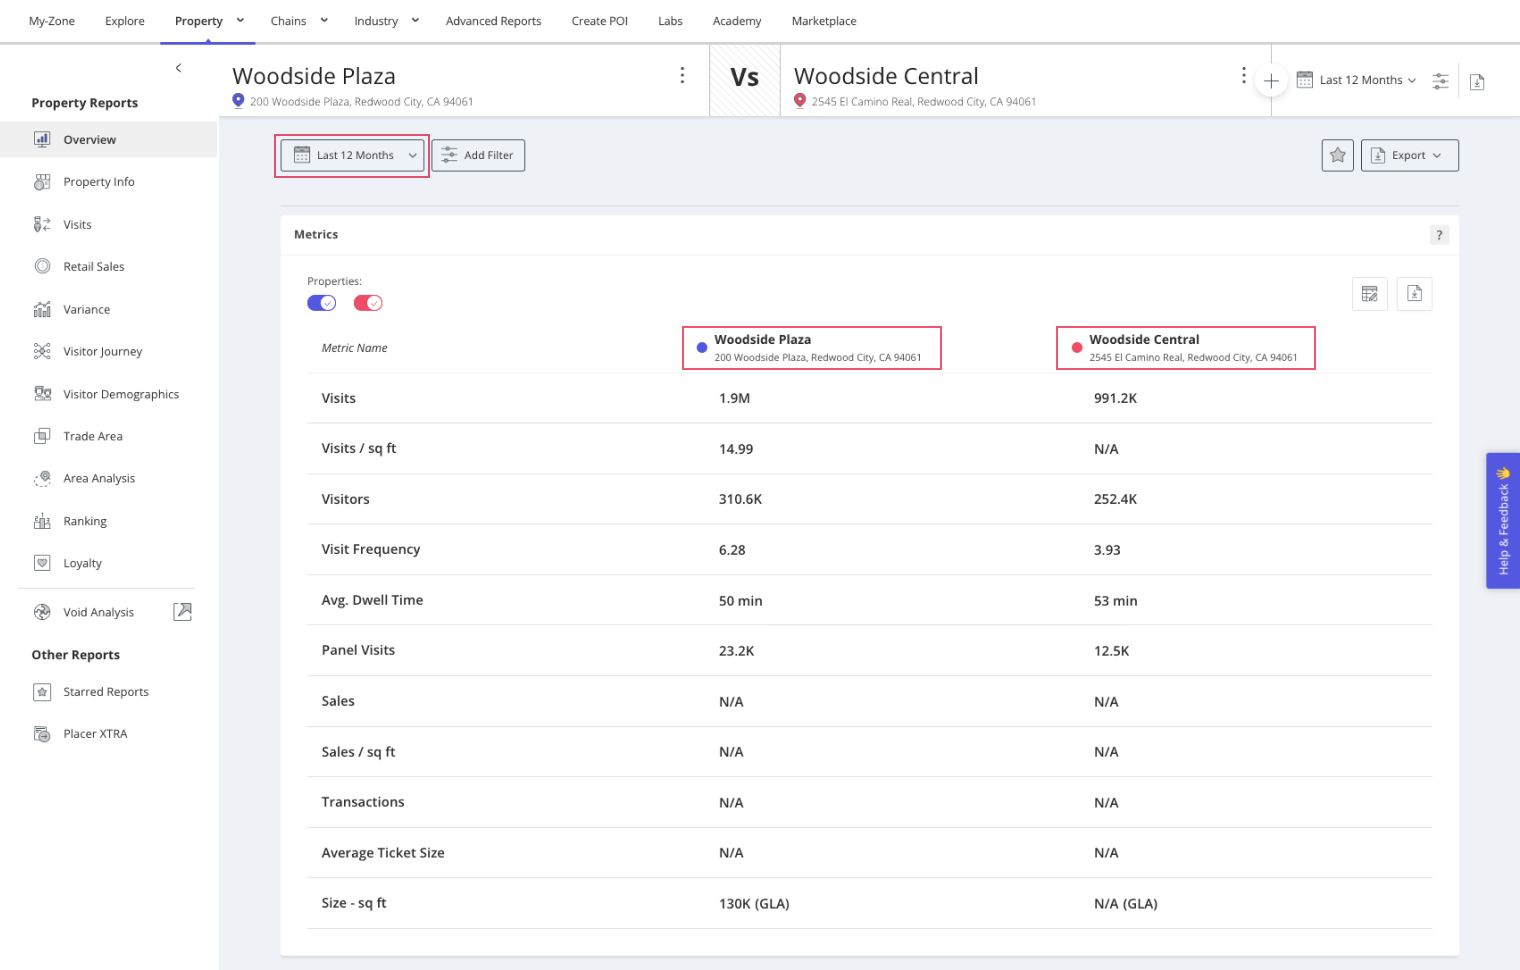
a. Navigate to Explore and type your POIPoint (Location) of Interest. into the search bar. Up to 8 POIs can be chosen at one time by checking the empty white box next to your POI in the center of the page or on the left sidebar. The number of POIs selected will appear at the bottom of the left sidebar. Once the POIs are selected, click Open Report and select Property. This will open the Property report.

b. Adjust the dates to any custom range. Reports will default to the last 12 months, so you can click the calendar icon and choose the preferred date range, then click Apply. For example, analyze and compare data side by side for your POI and its competitor. Look at the estimated number of customers and visits (Metrics), the visit trends (Visits Trend), the performance of your locations (Ranking Overview), visits at any time of day (Hourly Visits), visits by day of the week (Daily Visits), and how long visitors spent at your locations (Length of Stay).
Learn about Foot Traffic Metrics
Step 2: Show center reach and visitor draw by analyzing trade areas
Navigate to Trade AreaRepresentation of the dispersion of home and work locations that drive traffic to any venue. in the left sidebar. Understand your visitors’ True Trade Area (Trade Area) and see the distance in miles required for visitors to reach the property (Trade Area Coverage by Distance). Filter by visitors’ home or work location, and by visit frequency to understand the travel patterns of more loyal visitors.
.jpg)
Learn about Trade Area Coverage by Distance
Step 3: See how your center and its tenants rank
a. Navigate to Ranking in the left sidebar and view the performance of your center and any existing tenant you want to evaluate (use the plus icon to add a location and click Go).
b. You can rank your locations against others in the same category or you can rank an existing tenant against its chain. You can also rank using total Visits or Visits per Square Foot.
c. You will see the POI’s rankings at the national, state (including options for DMA or CBSA), and local mileage ring granularities.
.jpg)
d. The Ranking Index section at the bottom of the page allows for a filtered view of the ranked locations.
.jpg)
.png)
.jpg)