
.jpg)
To reach your target audience, you must know where your customers are and how to deliver a message that will resonate with their interests and buying patterns. Done correctly, informed advertising like this will minimize wasted ad spend through highly targeted advertising. This article will cover how to use Placer data to maximize ad efficiency in both digital and out of home (OOH) advertising.
You’ll be able to answer these questions after reading this article:
- Which zip codes draw the highest proportion of my guests?
- What roads do my customers take, and what billboards would thus be best?
- How do I geotarget my digital media campaigns to a True Trade Area?
Step 1: Determine your customer profiles
If you are unsure of your guest’s attributes or segments, review the “How to Determine Key Customer Profiles” article.
Step 2: Analyze and Optimize Out of Home Advertising
If your media planning involves out of home advertising, Placer data can help you in choosing the optimal billboard placement.
Understand Visitor Journey
Before identifying the proper billboards, it is best to identify the customer journey, including where they go before and after your venue and the roads most used by your guests when visiting your venue or a venue of interest, allowing for the most impactful placement.
a. Find your location, and launch a Property Report.
b. From within a Property Report, navigate to Visitor Journey in the left side bar. In the example below, Visitor Journey shows which locations people visited right before and after they went to Melt Ice Creams.
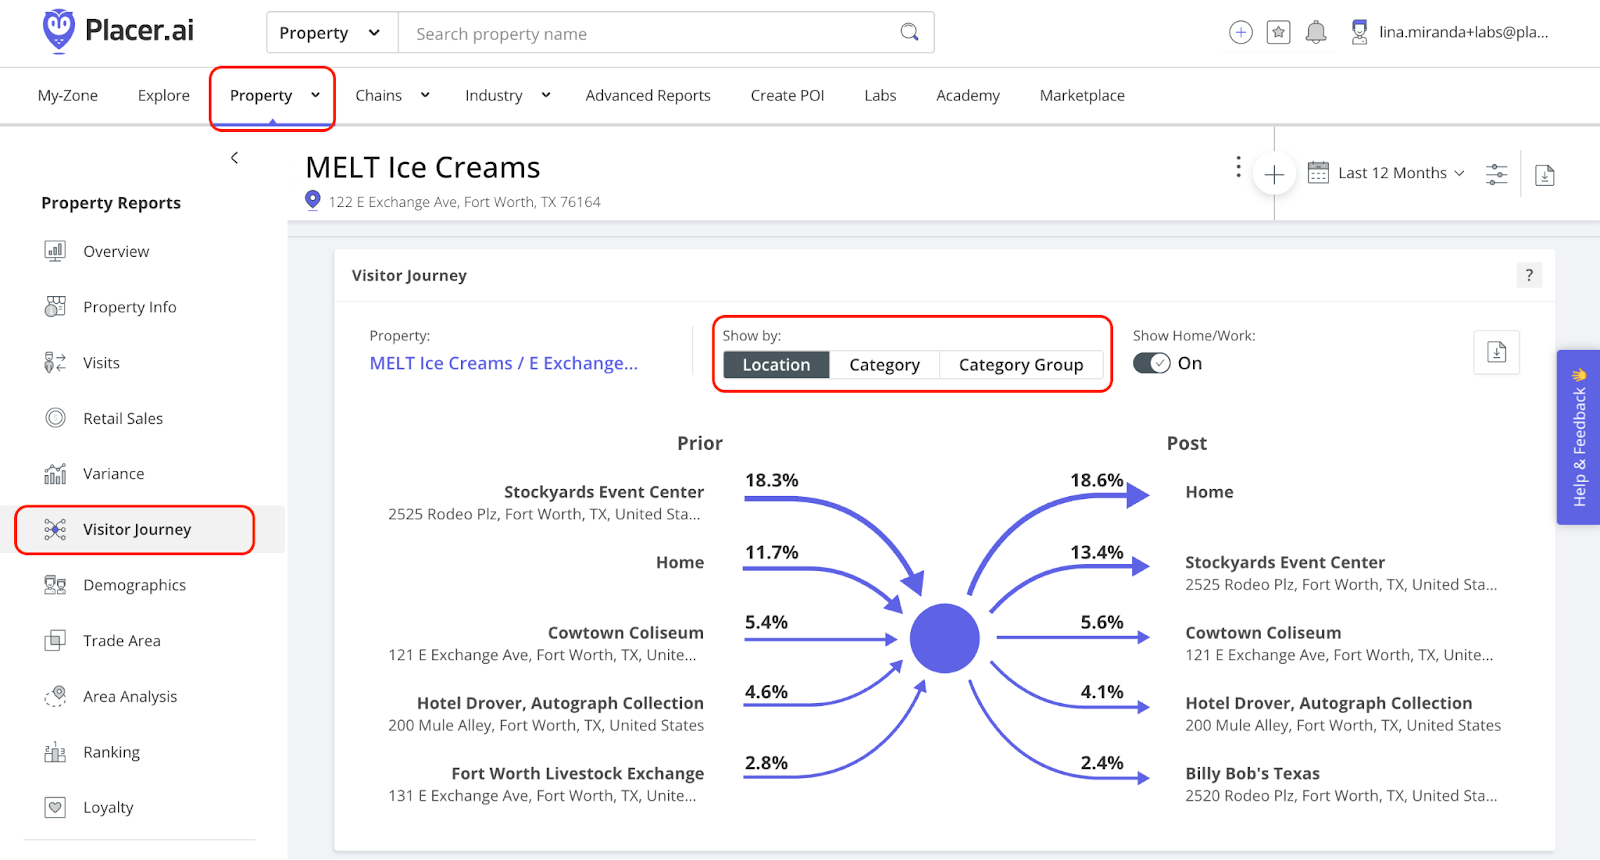
We see that many MELT Ice Creams visitors come from and go to the Stockyards Event Center. Therefore, we may want to consider sponsoring or advertising at Stockyards Event Center. We could even offer a special promotion to their visitors to draw even more people to MELT Ice Creams.
b. Scroll down to the “Prior / Post Compare” widget to view more detail.
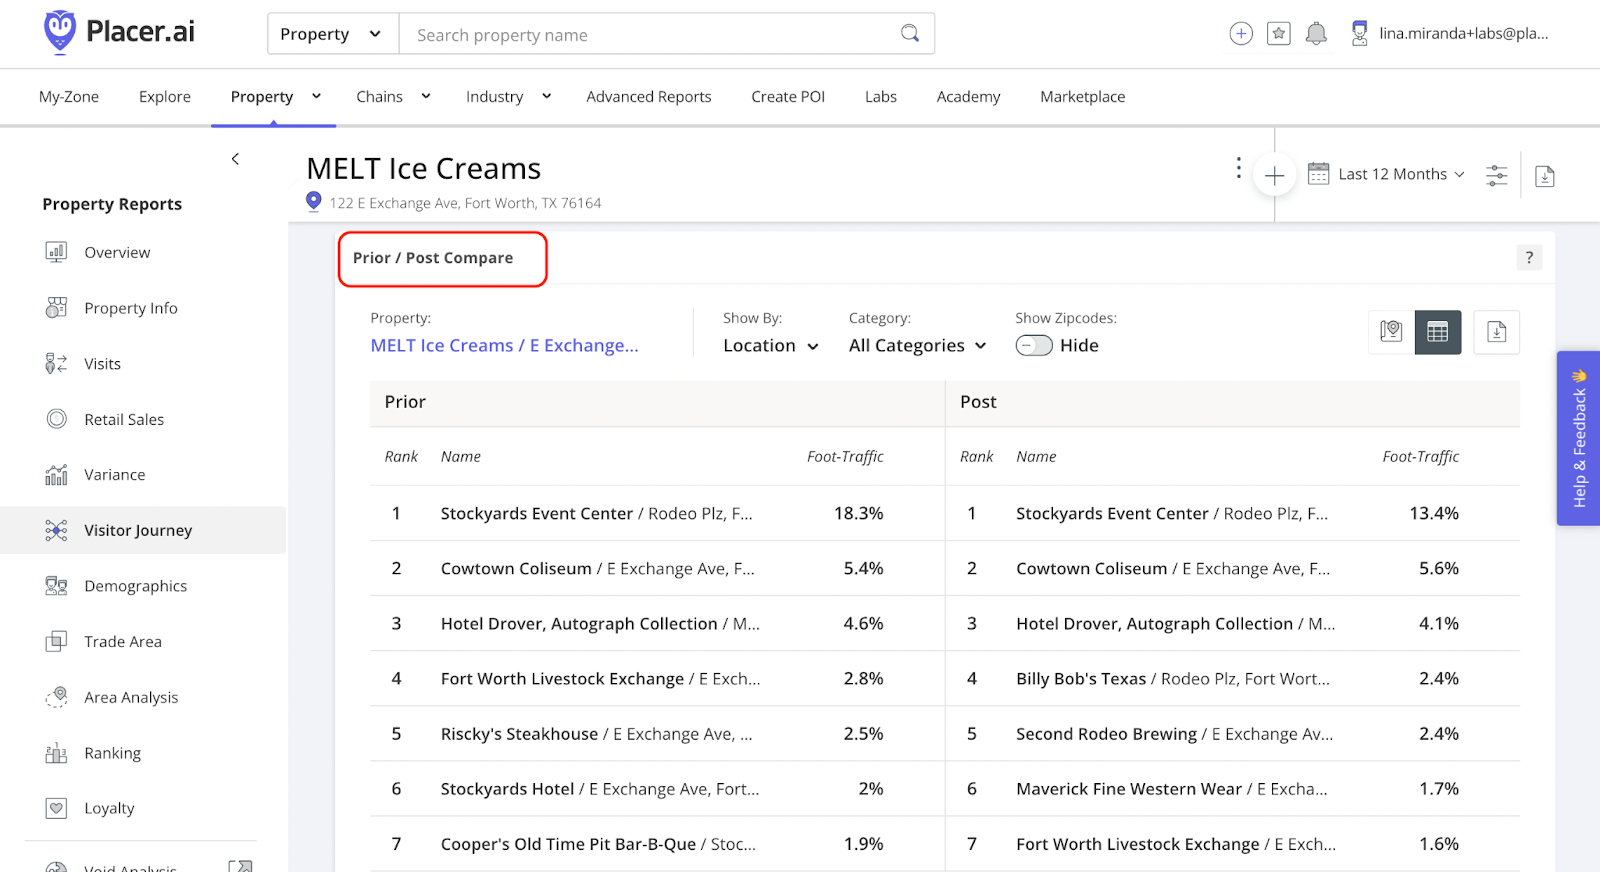
Here we see that some visitors come from Riscky’s Steakhouse, so we may want to partner with Riscky’s to sell our ice cream at their restaurant to increase brand awareness and future sales potential. Since I see that some of my visitors tend to go to Second Rodeo Brewing right after, I could collaborate with the brewery to make a beer-flavored ice cream to drive even more interest in my products.
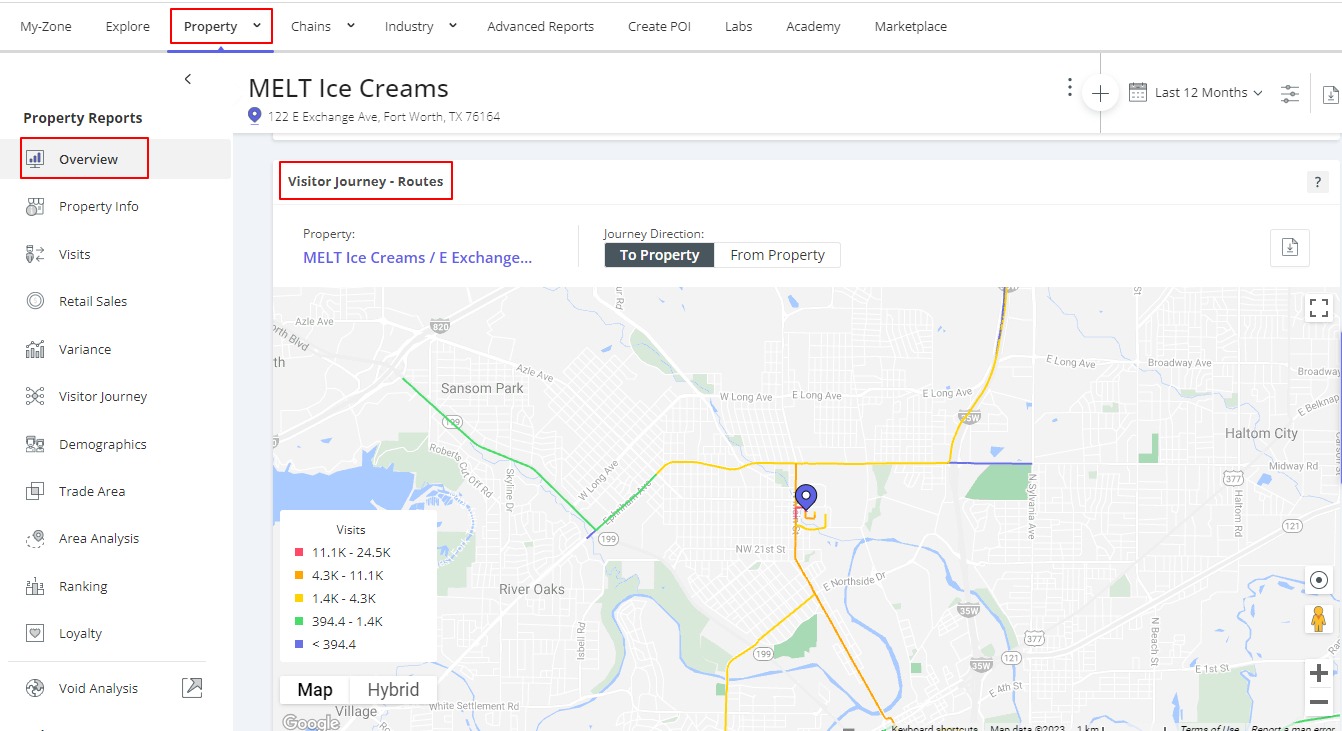
c. Now, review the roads taken by navigating to Overview and then Visitor Journey - Routes. This will help identify areas of interest for possible billboards.
Meet with your ad partner to review and compare possible billboards
Step 1: Select specific ad units and time periods to compare
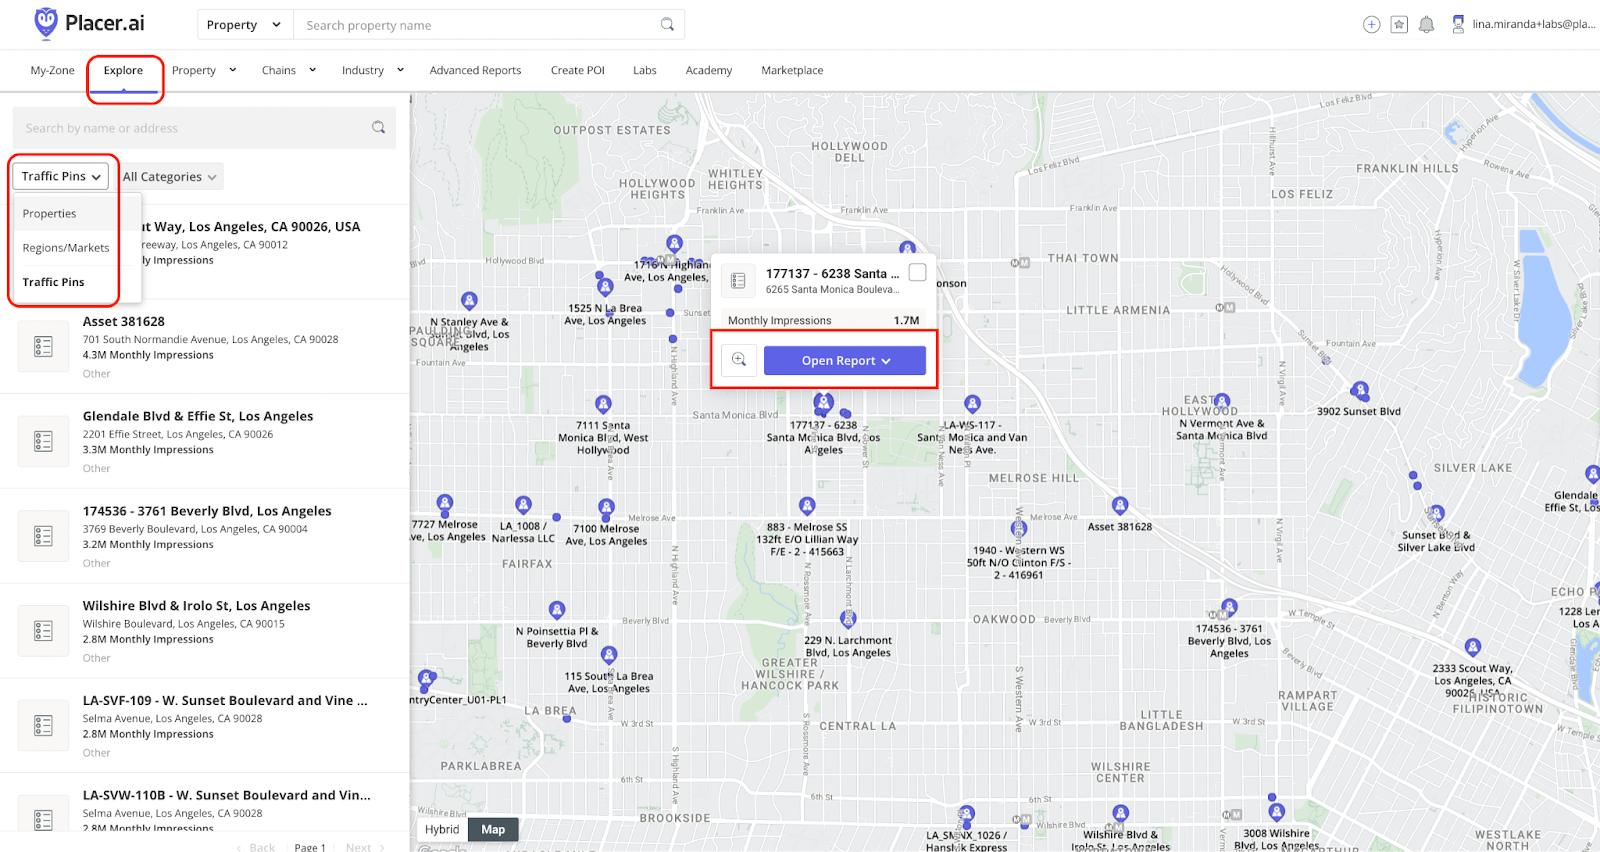
a. Navigate to the Explore tab. Specific billboards, OOH ad units, or similar POIs are typically represented in the Placer UI as “traffic pins”. Select “Traffic Pins” from the POI category selector drop-down menu near the top left. Select your desired POI within the map. Click the purple “Open Report” button, causing a drop-down menu to appear. Click on “Traffic Pin”, and the report will open in a new tab or window. We use sample billboards in and around Los Angeles for the purposes of this article.
Learn about Traffic Pins
b. In the Property Reports tab, select any time period you’re interested in analyzing using the calendar drop-down below the map image. Optionally, you may add up to 8 different POIs (e.g., traffic pins representing specific billboards or OOH ad units) for comparison.
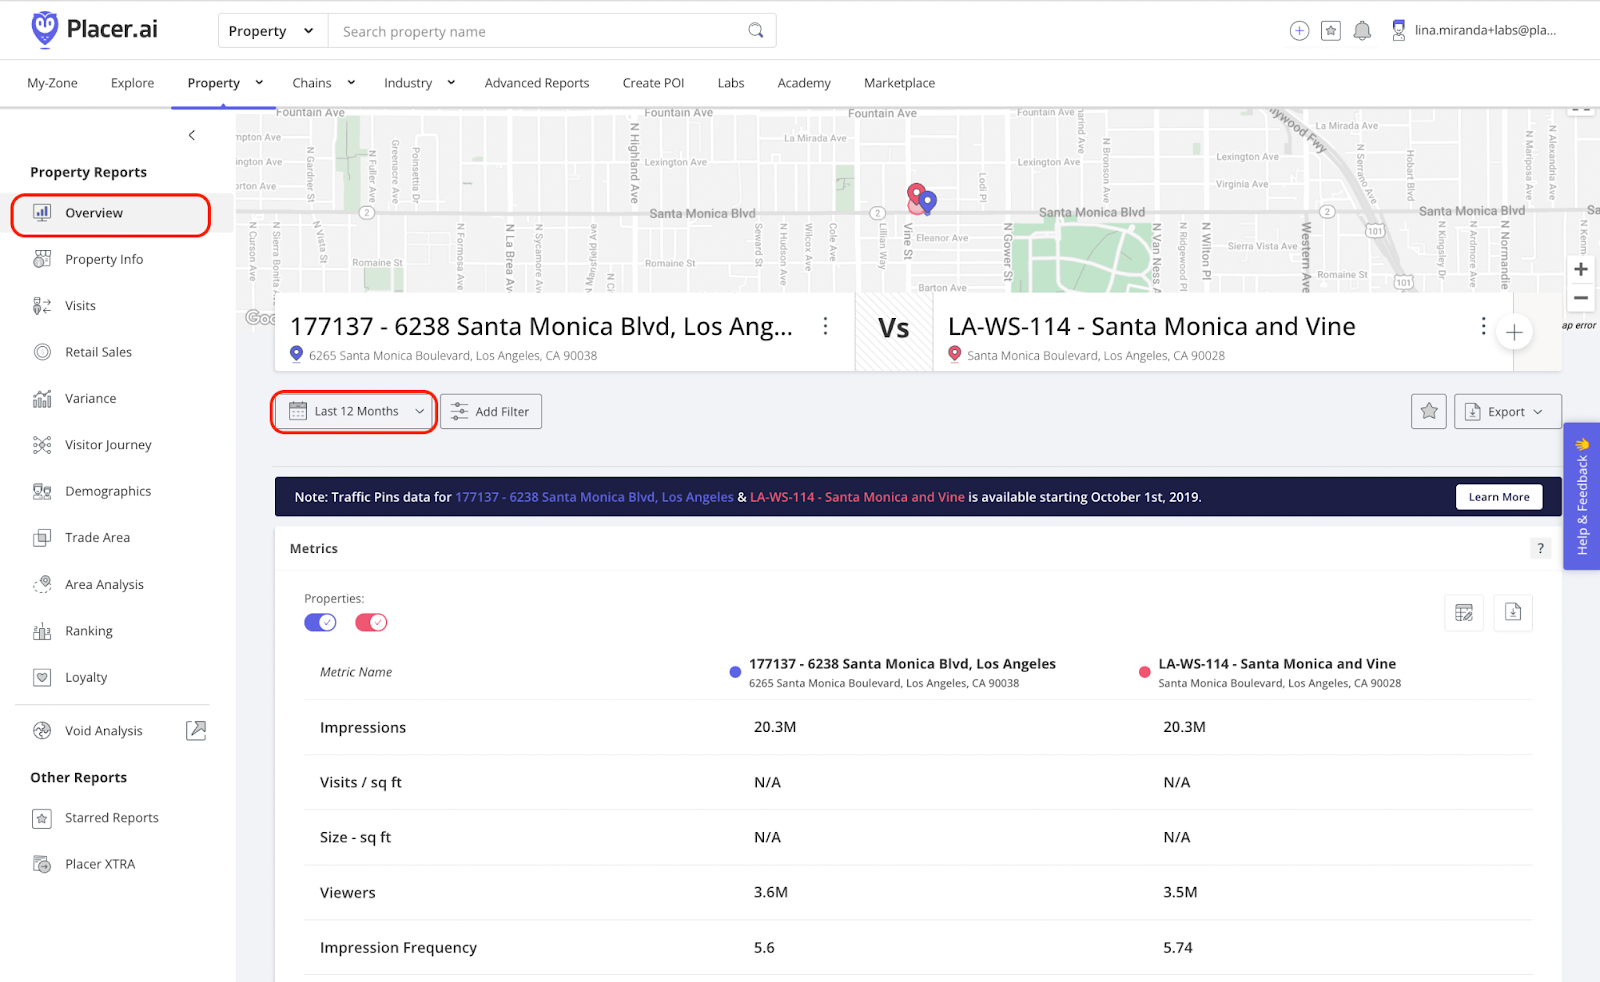
Step 2: View and compare detailed reach metrics for individual OOH ad units.
a. In the Overview Property Report, review the Metrics widget to see detailed exposure metrics, including impressions, viewers (the extrapolated number of unique viewers who were exposed to the ad unit), impression frequency, YoY (year over year) growth metrics, and more.
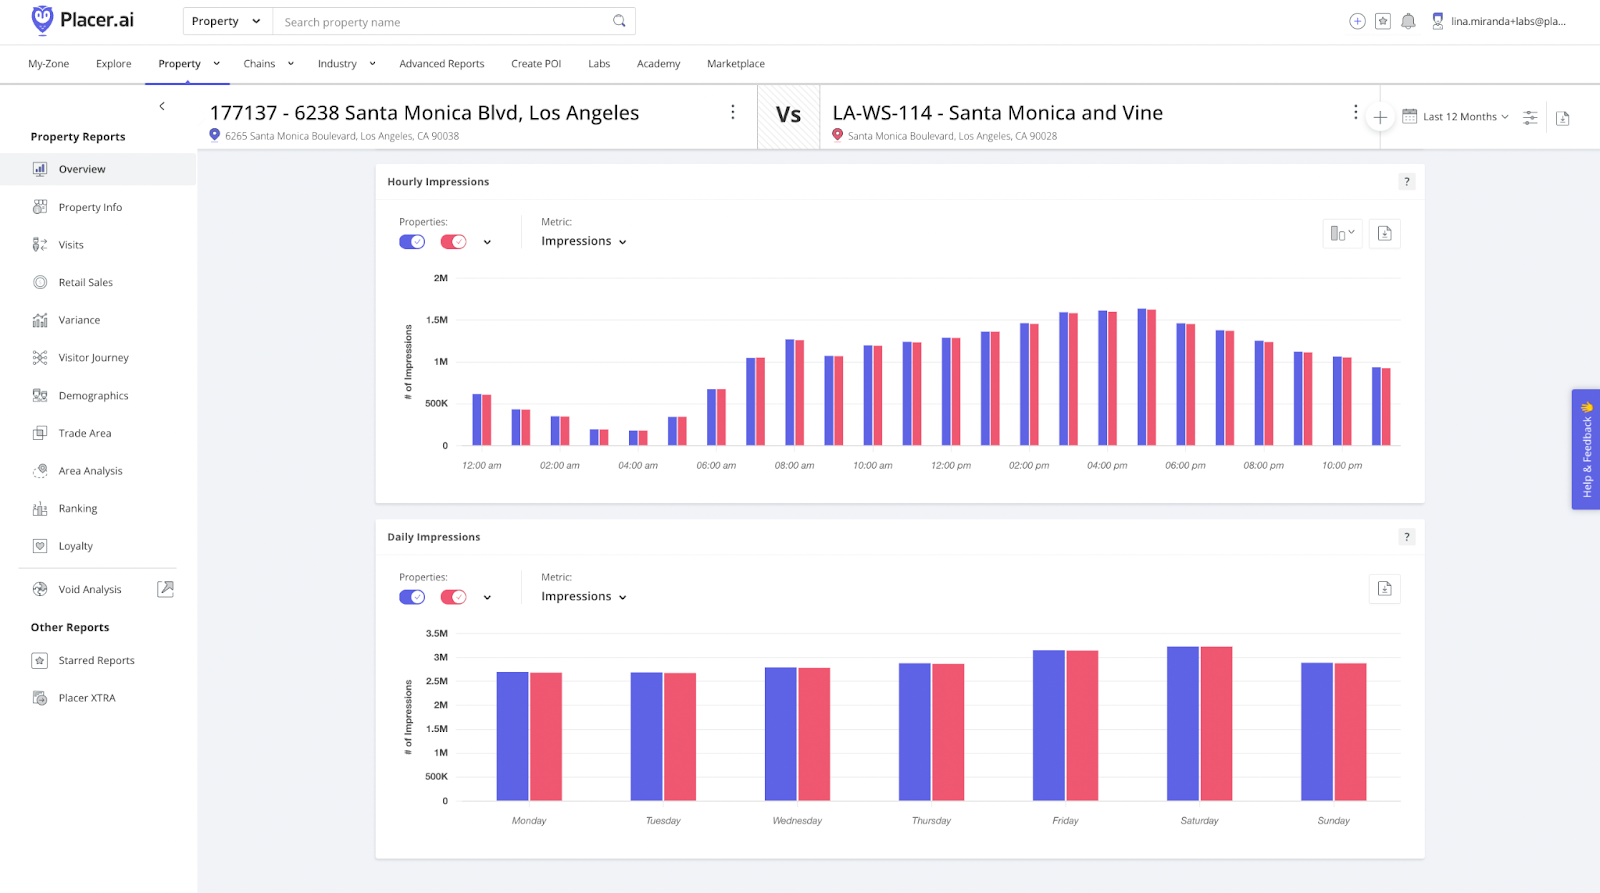
b. Scroll down to view the impressions trend for the selected POI(s) over the time period. Ensure that the “Outlier Indicator” toggle is flipped on, and then notice the dots indicating outliers on the trend line. Click on a dot to launch Placer Assist, which provides helpful information and insights about that day, to help you contextualize the spike or dip.

c. Scroll down to view hourly and daily impressions trends. This is especially useful if you’re considering digital ad units that can be targeted by day-of-week or day-part.
Step 3: Assess traffic patterns and compare the local context for individual OOH ad units.
When evaluating specific OOH ad units, it’s crucial to understand the surrounding environment, community, and local culture. This knowledge can help both validate that specific ad units are a good fit for your brand, and help tailor your message to resonate better with the local audience.
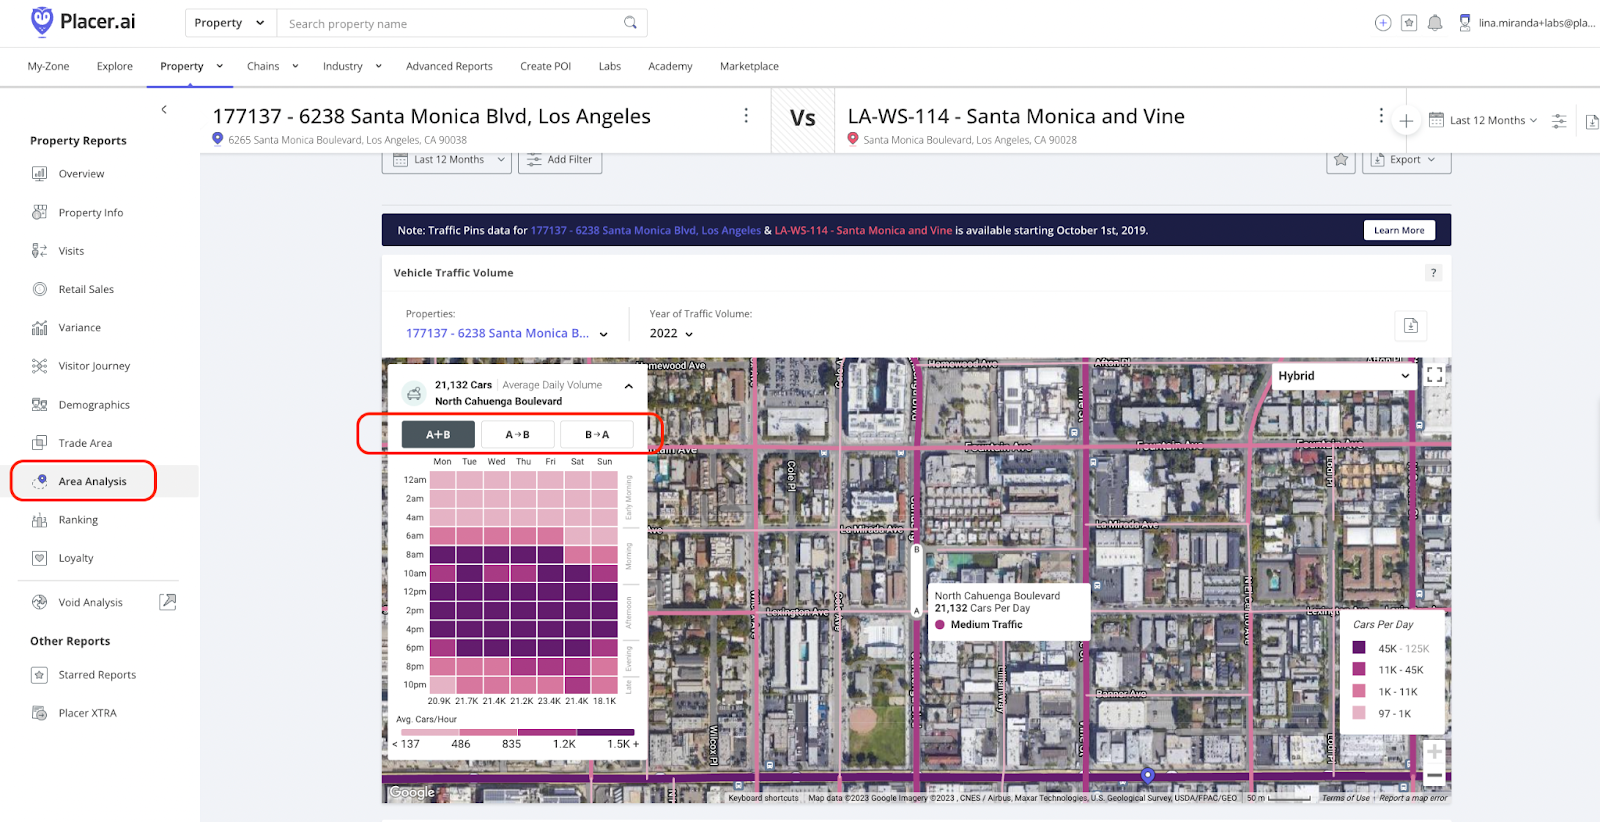
a. Navigate to the Area Analysis report. The Vehicle Traffic Volume widget shows the average daily traffic volume for specific road segments surrounding your selected ad units. Select the road on which the ad unit is located to see a detailed grid visualizing daily traffic by hour. The vehicle traffic accounts for the direction of traffic, so you can view:
- Total traffic (traffic from point A to B + B to A)
- Directional traffic (traffic from point A to B)
- Directional traffic (traffic from point B to A)
This helps you to analyze traffic routes to validate that an ad unit is well-positioned in a high-traffic area.
b. Scroll down to view the Crime widget, which visualizes all the crime incidents that took place around the ad unit(s).
Crime statistics can be an important factor when considering the value of a billboard or OOH ad unit. High crime rates in an area can impact audience safety, brand perception, and message reception.

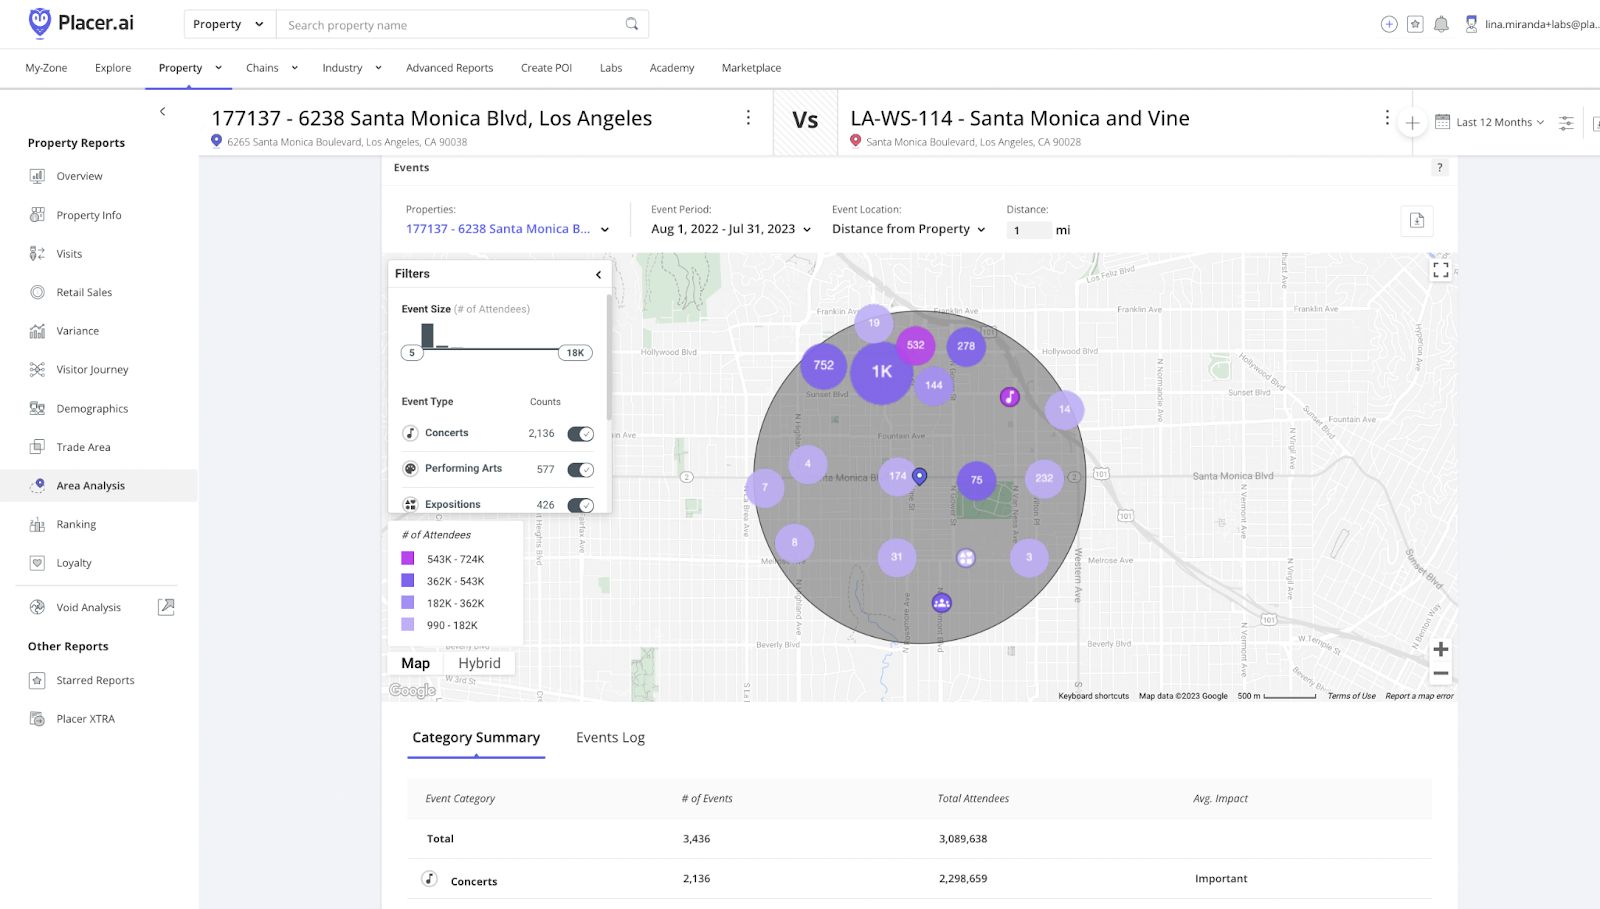
c. Scroll down to view the Events widget, which shows all of the events taking place around the ad unit(s).
Understanding which events will occur during your planned campaign flight dates can help value billboards as well as help inform your ad creative. Events can increase foot traffic, draw specific target audiences, and might even result in PR/media coverage. Relatedly, aligning your message with event themes creates contextual relevance, booting the resonance of your ad.
Learn about Events
Step 4: Understand and compare the audiences reached by individual OOH ad units.
Audience is arguably the most important factor to consider when choosing specific OOH ad units. It’s critical that the audience exposed to your ad units mirrors the target audience for your campaign.
Placer’s Audience Profile report allows you to explore a multitude of audience attributes so you can gain a deep understanding of the audiences that are exposed to specific ad units under consideration. Learn more about this robust audience data here: Perform in-depth consumer analysis for specific locations.
Step 4: Analyze and Optimize Digital Advertising
Use Visitors by Origin to analyze top zip codes for specific locations
a. Open the Placer report for the POIPoint (Location) of Interest. Navigate to Trade Area in the left sidebar and scroll to Visitors by Origin. This presents the home or work zip codes of most of your chosen POI’s visitors.
.jpg)
Learn about Visitors by Origin
b. You can analyze visitation per zip code using the following metrics:
i) # Visitors - Presents the number of visitors that visit the property from each zip code displayed on the map
ii) % Visitors - Presents the percentage of visitors that visit the property from each zip code displayed on the map
iii) Year Over Year (YOY) Change - Presents the change in visitation per zip code, compared to 1 year ago
.jpg)
Pro Tip: In addition to analyzing your locations, you can also analyze your competitors’ top zip codes for competitive conquesting campaigns!
c. This data can be downloaded and used to choose which zip codes to target via digital campaigns.
.jpg)
Pro Tip: Create custom chains and tags to manage your clients' advertising campaigns at scale.
Analyze entire chains or custom lists with Placer XTRA
a. If you're advertising chains with many locations, or if you’ve created custom tags and would like to export a list of zip codes spanning all locations within your custom tags, use the Placer XTRA CBG & Zip Code Export report. Navigate to Advanced Reports in the main menu, and then select Placer XTRA from the left-hand menu.
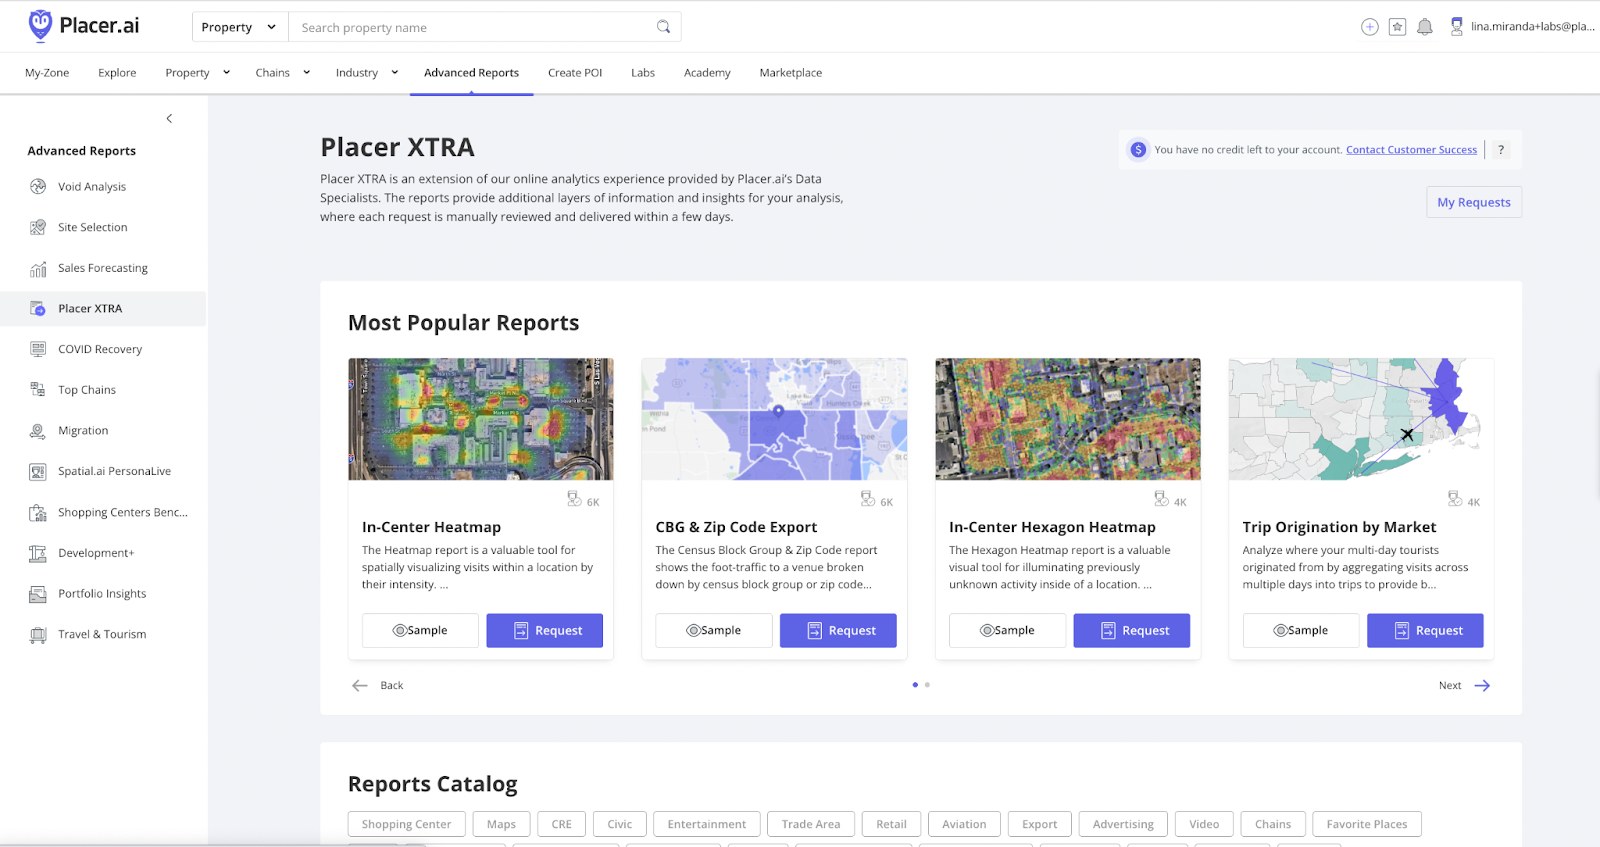
b. Within Placer XTRA, select the CBG & Zip Code Export report. This report shows the foot-traffic to a venue broken down by census block group or zip codes. Complete the form to request the report.
c. Once you’ve received the report, we recommend that you remove the zip codes that make up the bottom 20-40% of your traffic, depending upon your goals and budget.
Upload target zip codes to your preferred digital buying platform
a. Use the exported top zips list to precisely geotarget your digital media campaigns. Many digital buying platforms allow you to copy and paste zip codes for targeting. Below are a few examples.
In Google Ads: Open Google Ads Manager and create or select a campaign. Within your "Campaign settings", expand "Locations" and select "Enter another location". Then click on "Advenced Search". Check "Add locations in bulk", and paste in your list of target zip codes.
In Meta Ads Manager: Open Meta Ads Manager and select a campaign objective for your ad set. Go to Audience and select your source audience. Then go to Locations and follow the prompts. For more information, visit these Meta support links: Use Location Targeting and Bulk Upload Formats for Location Targeting
The following video walks through the process of geotargeting campaigns in Google Ads and Meta Ads Manager:
Refresh your data quarterly
a. Be sure to refresh the zip codes at least every three months to make sure you account for any changes in your trade area.