
.png)
The Placer.ai dashboard provides multiple tools to help you find underserved routes for your airport. Use Visitor Journeys, True Trade Areas, and Placer.ai’s Advanced Reports to discover unmet demand based on a series of insights including visitors’ favorite destinations and visitor origination.
You’ll be able to answer these questions after reading this article:
1. Which routes might have demand for direct service from your airport?
2. Which markets do travelers from your region visit?
3. Which zip codes or CBSAs do travelers to your region or a specific point of interest come from?
Individual steps are listed below, and are also available via video in the webinar recording at the bottom of the article.
Get started with the following steps:
Step 1: Visitor Journey: Explore other airports that passengers visit
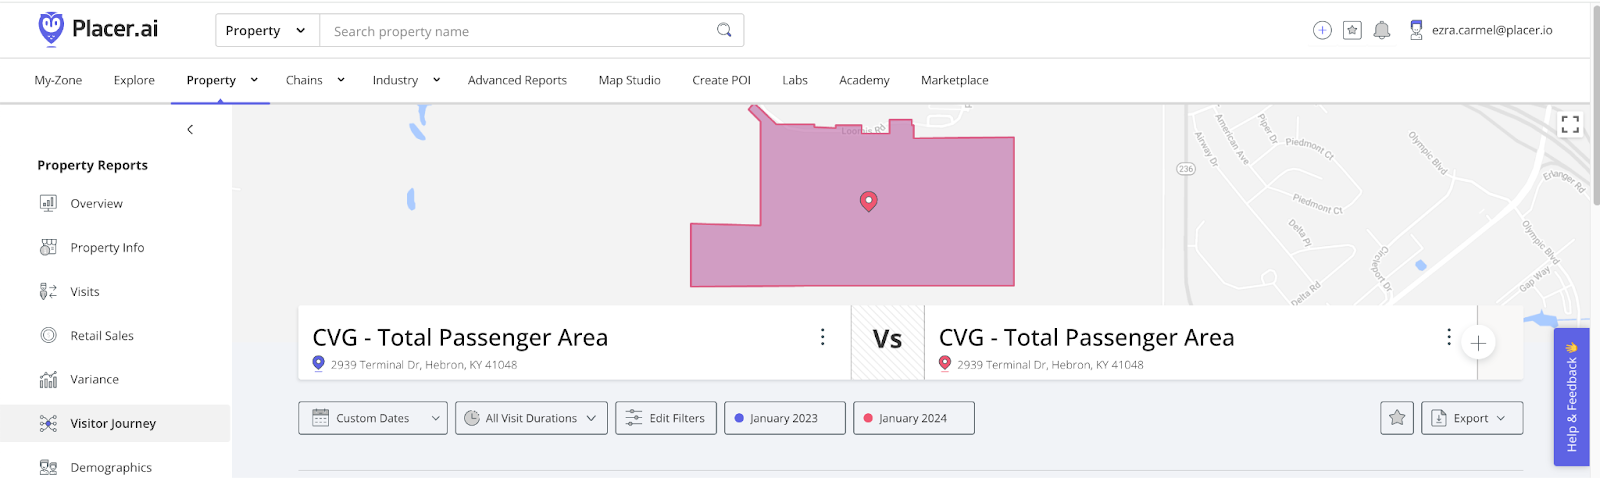
From the Property Tab, find your airport’s passenger area. This will give you information on actual travelers by excluding visitors in other areas. Add this POI again to compare passenger data over time and select a time frame for your analysis.
Using the filters under the POI name, you can compare travelers at your airport on different days of the week or times of year. You may want to compare a competing airport for benchmarking.
Navigate to the Visitor Journey page from the left sidebar.
Scroll to the Favorite Places widget.
Use the Category filter tool at the top left corner to isolate results for airport facilities within the travel category.

You now have a list of other airports your passengers visited during the chosen timeframe. If you don’t already offer a direct route, it may be worth exploring adding service.
Learn more about Favorite Places
Step 2: Request a Trip Origination By Market XTRA Report: Uncover regional route demand
a. From the Advanced Reports Tab, navigate to the Placer XTRA Reports page from the left sidebar.
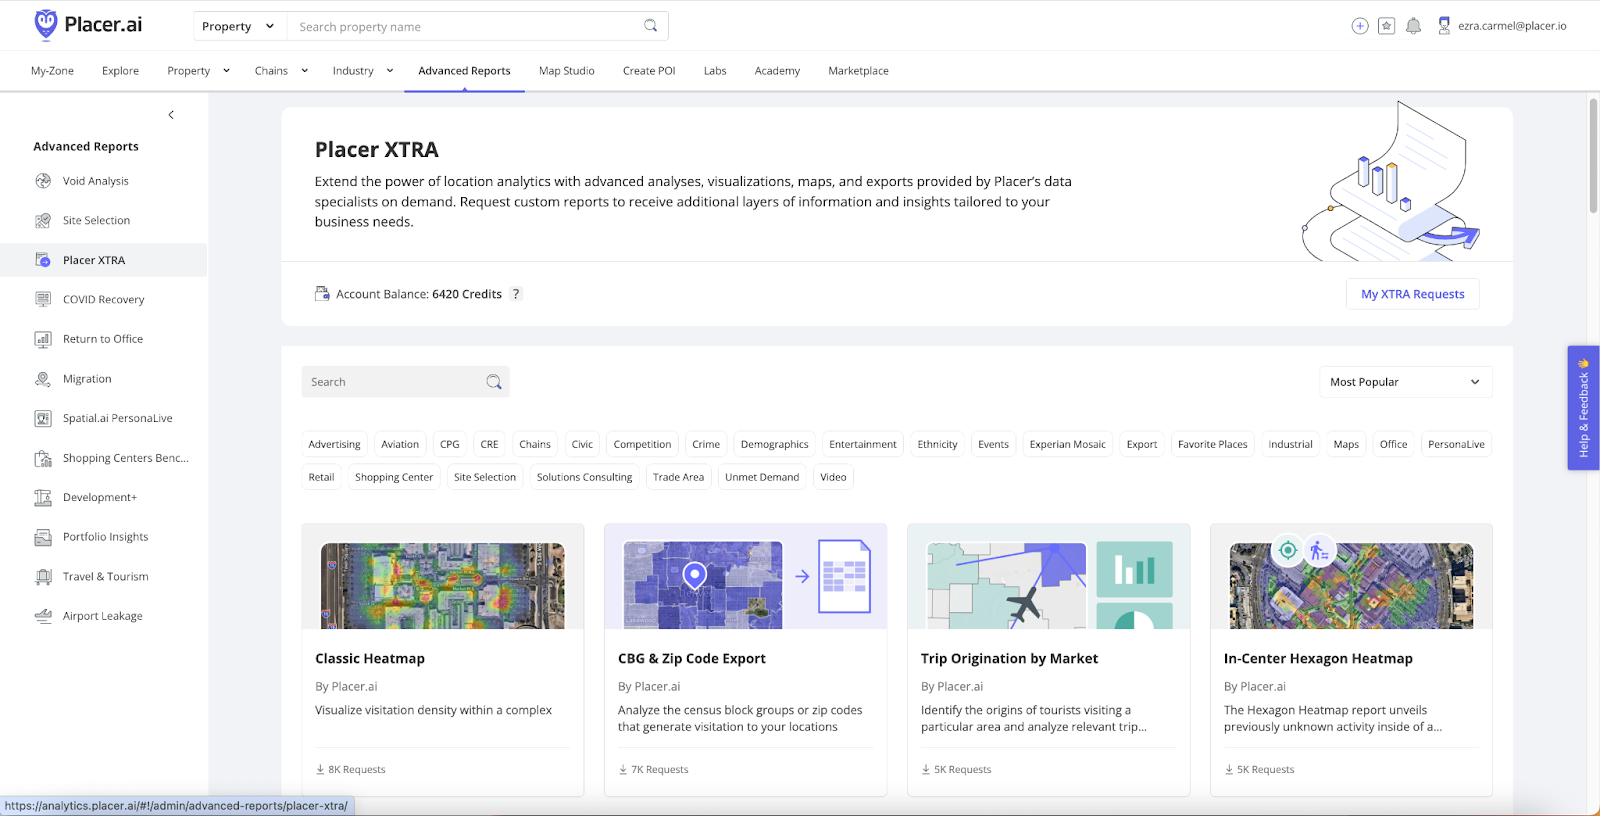
b. Open the Trip Origination by Market Report.
c. Request a catchment for an MSA/County with an airport that you would like to explore providing service to.
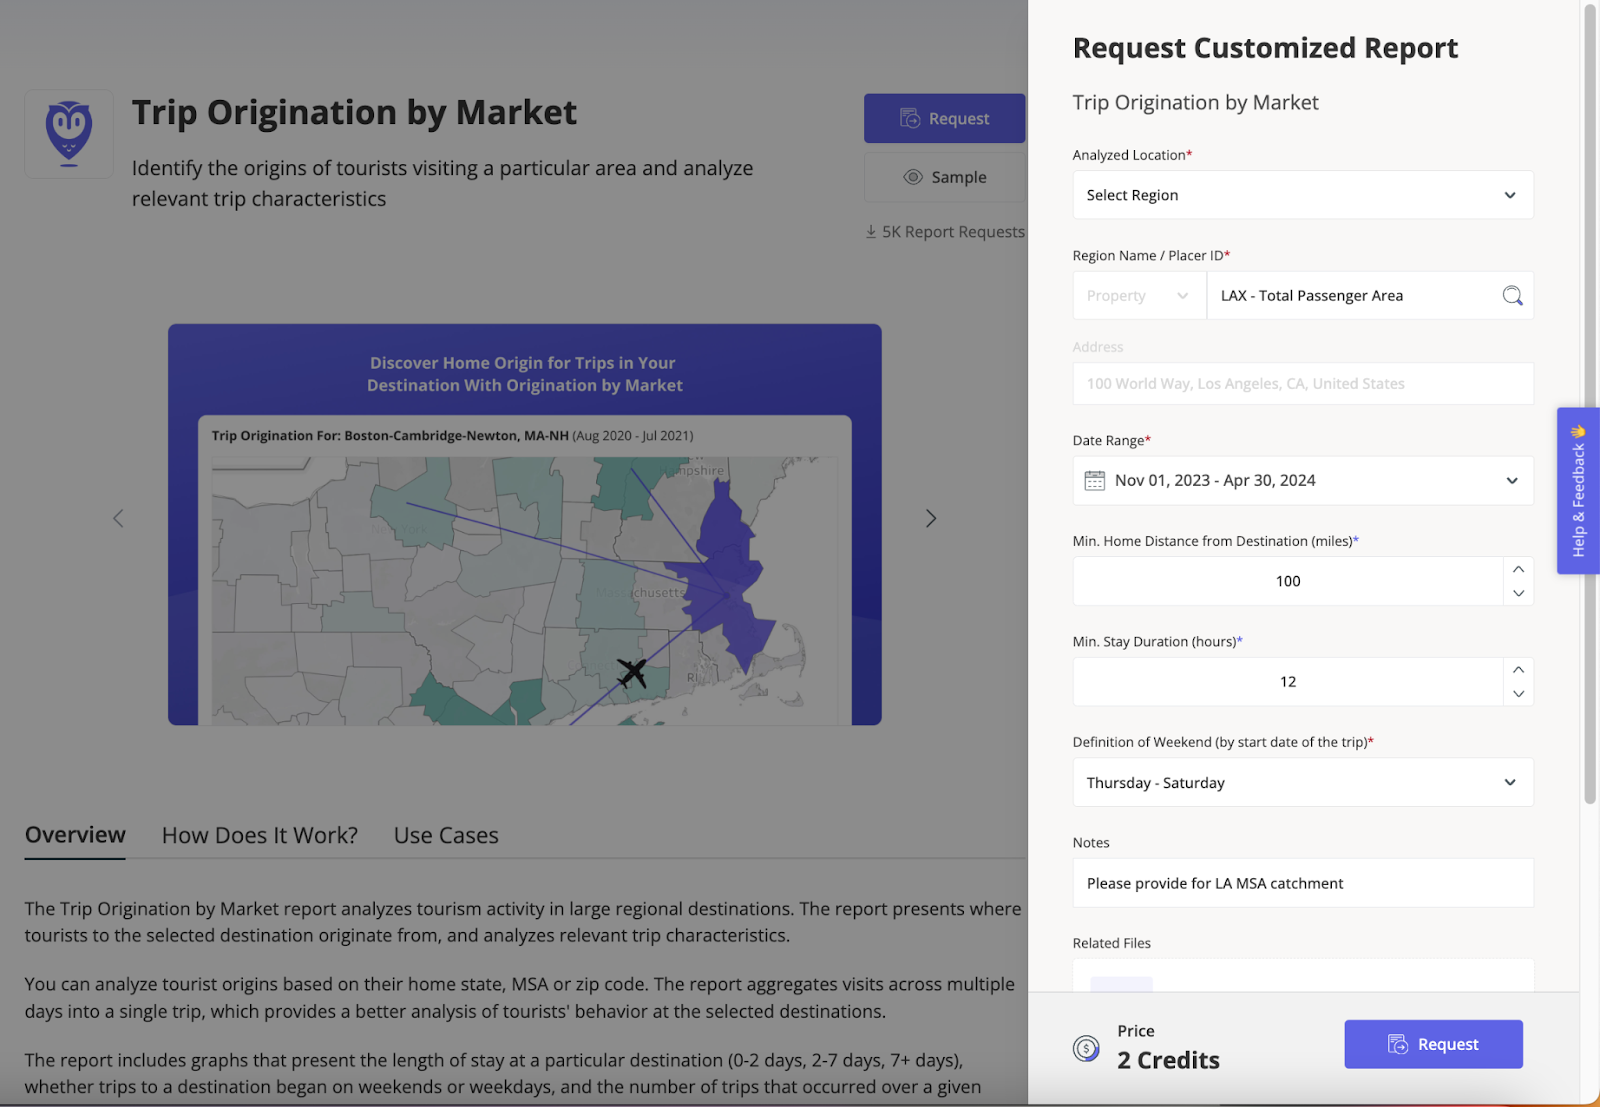
You can also request to base your catchment on a specific drive time from a destination airport.
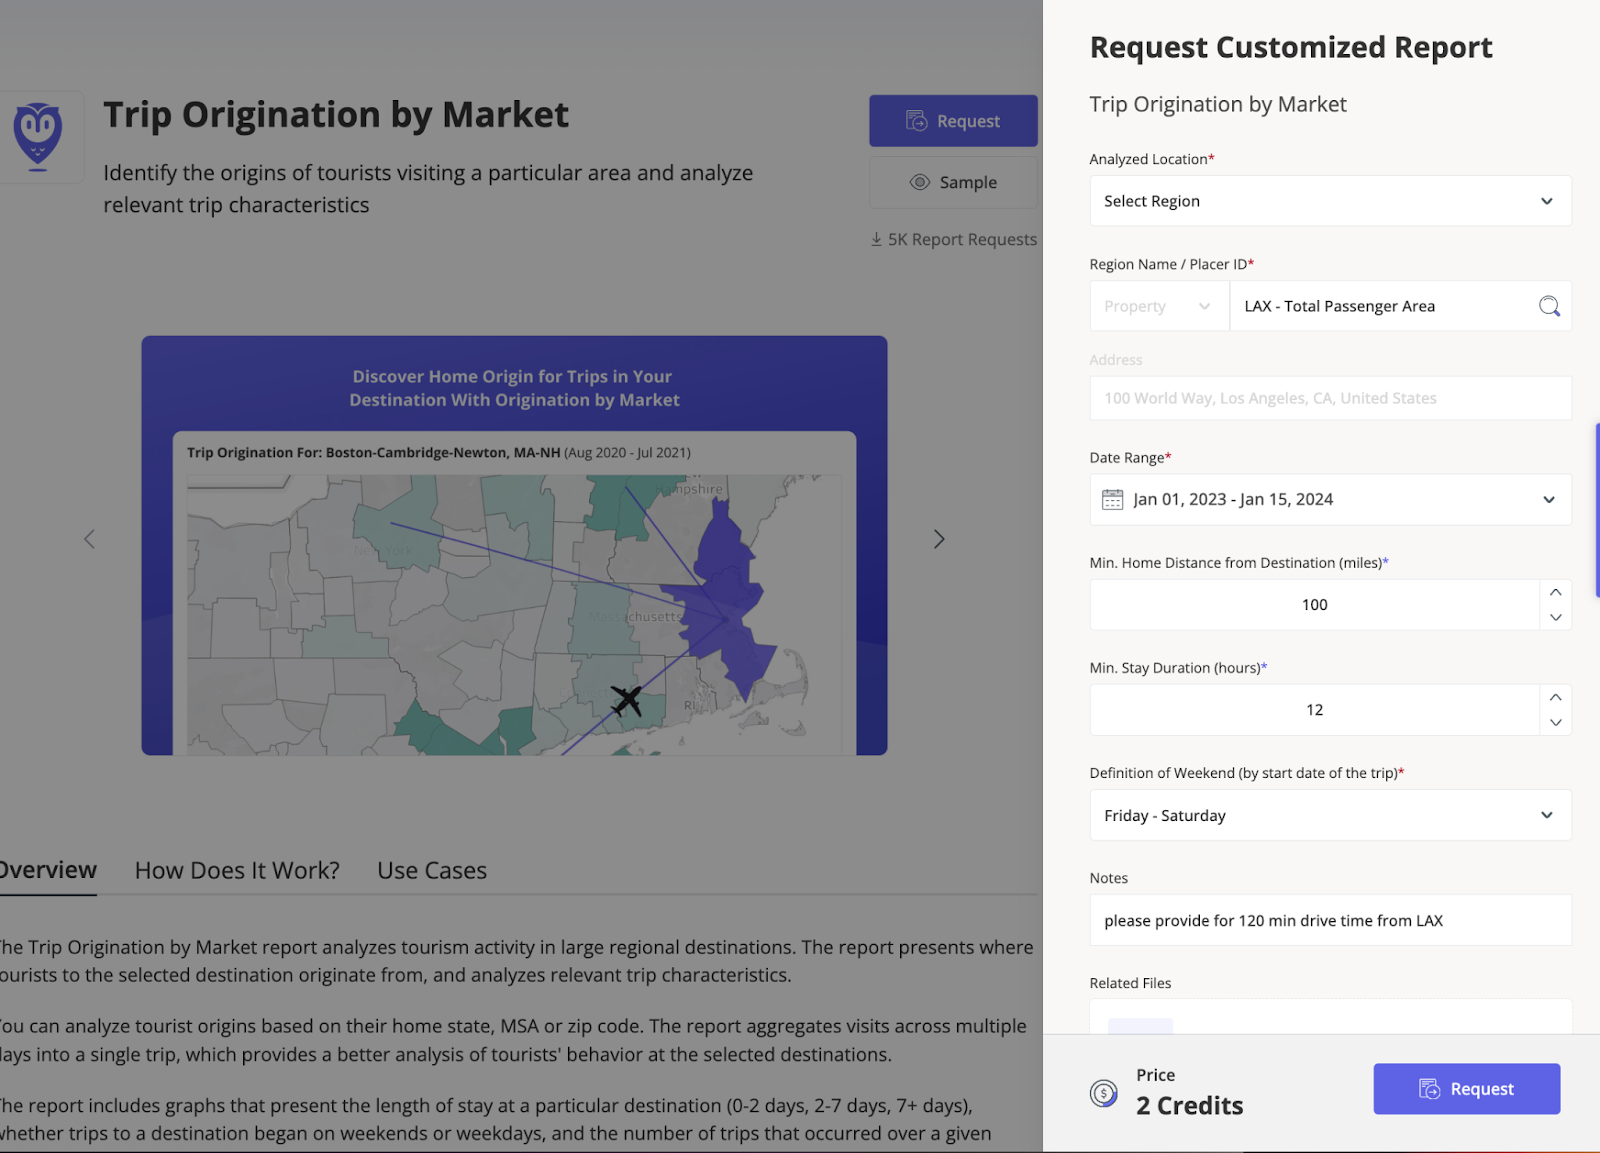
Pro tip: For the most accurate view of air travelers, Placer.ai recommends defining minimum home distance from destination as at least 100 miles and minimum stay duration as at least 12 hours. This will help exclude connecting passengers and non-air travelers.
When your report is ready, it will appear in the My Zone tab under My Requests-Placer XTRA in the left sidebar. Reports are available to view or download.
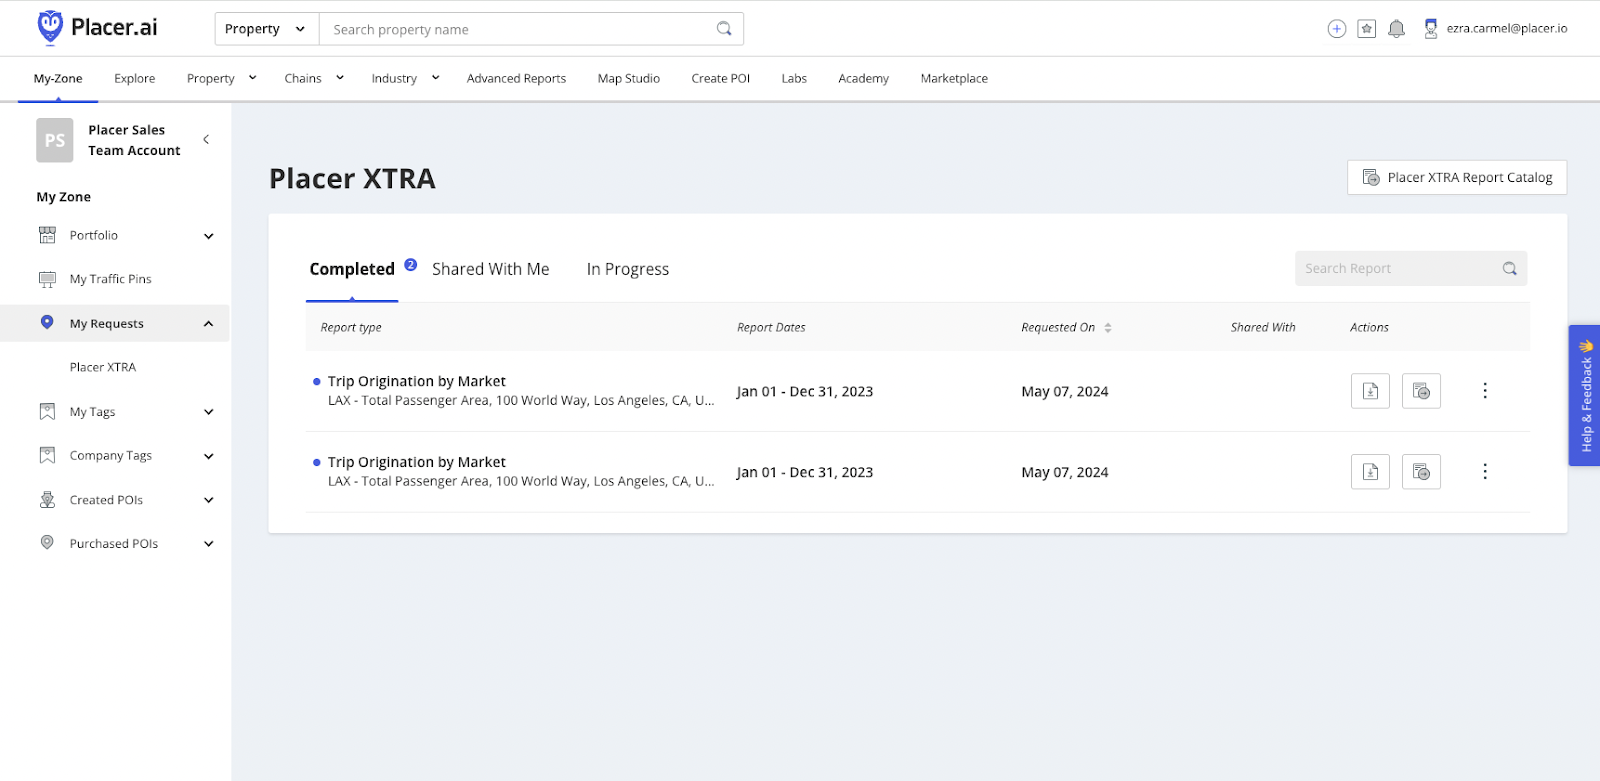
d. In the report, Select MSA as the region type from the dropdown menu.
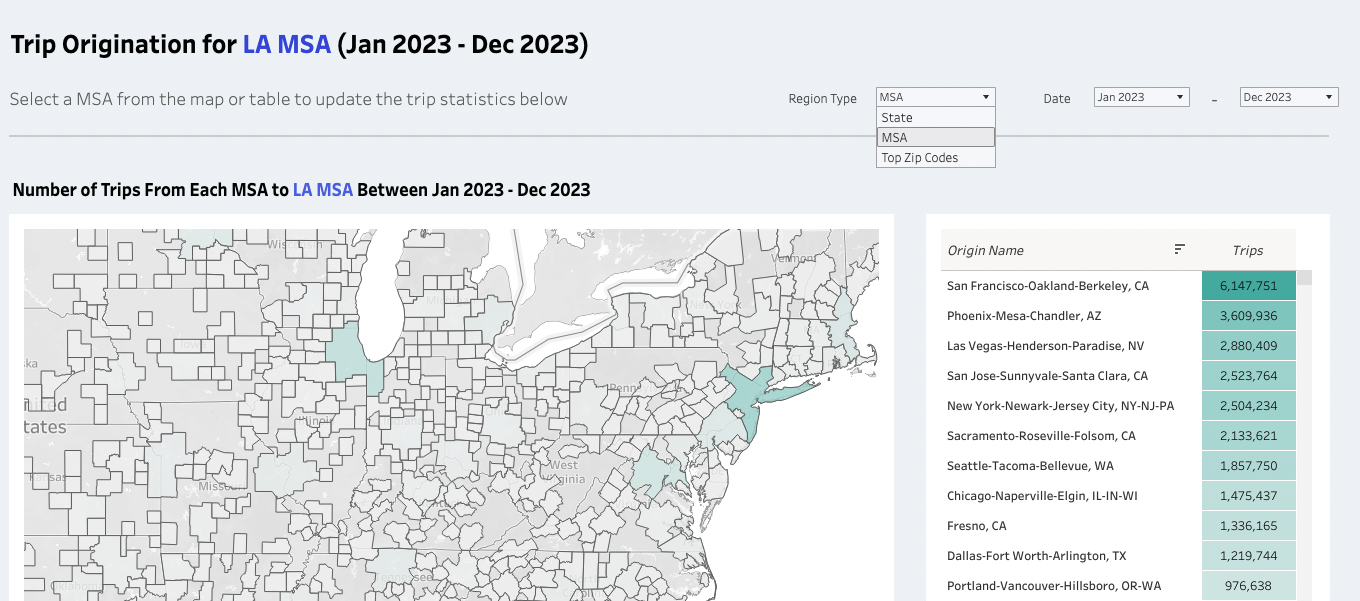
e. Click on the MSA which contains your airport. This will display the total number of trips to the report’s catchment from your MSA.

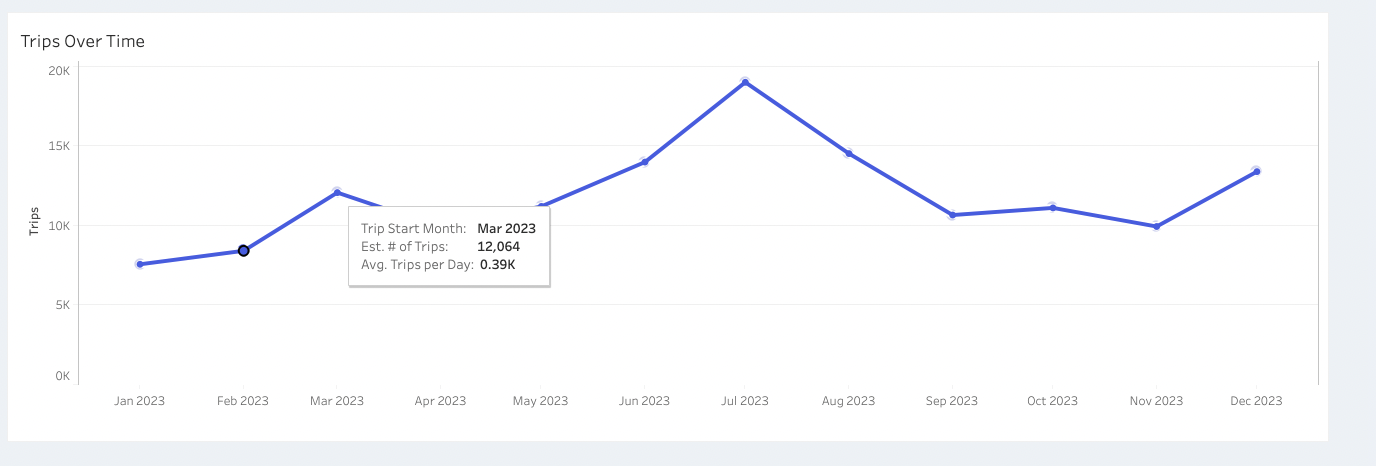
f. Scroll down to view estimated monthly and average daily trips to the report’s MSA from the MSA which contains your airport. You’ll also find a breakdown of trips by weekend vs. weekday and trip duration.

High trip volume from your airport’s MSA to another could indicate demand for a route from your airport to one in the report’s MSA.
Learn more about Placer XTRA
Step 3: Visitors By Origin: Get a list of origin zip codes for travelers
This analysis can help you explore potential in-demand routes by revealing the home zip codes of travelers to your region.
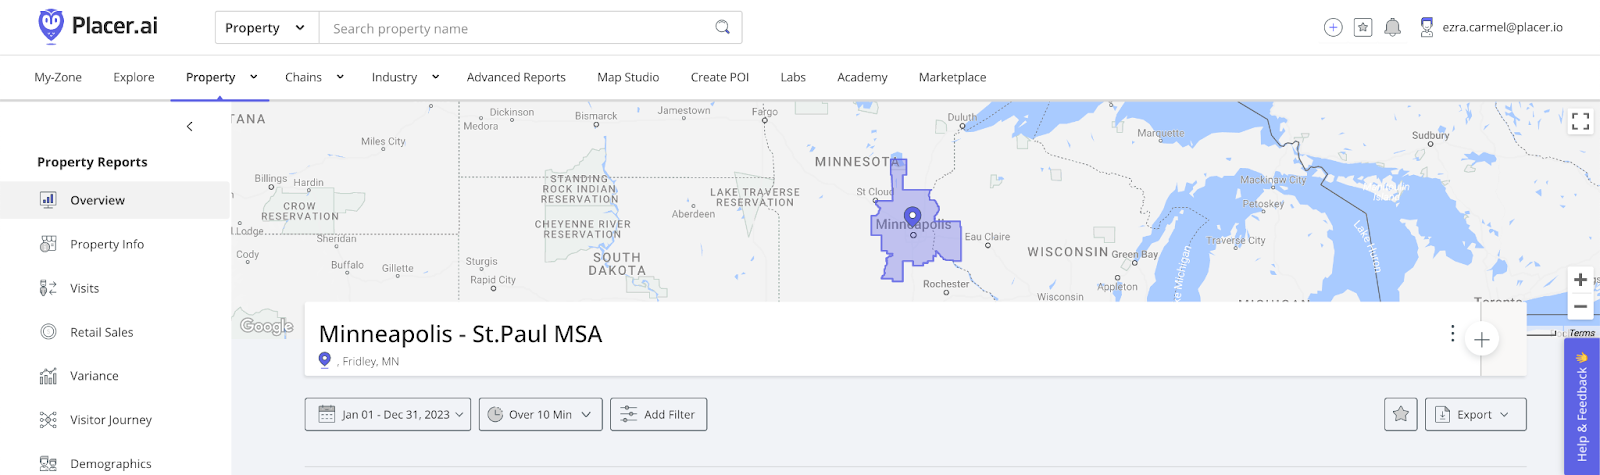
a. In the Property Tab, search for the MSA in which your airport is located and adjust the desired timeframe.
In this example, Minneapolis - St. Paul International Airport (MSP) is exploring underserved routes into the Minneapolis - St. Paul MSA.
Pro Tip: Add a time filter to include only visits over 150 minutes in the reporting. This will exclude short-stay visitors who are unlikely to be air travelers.

b. Navigate to the the Trade Area page and scroll to the Visitors by Origin widget.
c. Download the CSV file using the download button in the top-right corner to view full results.
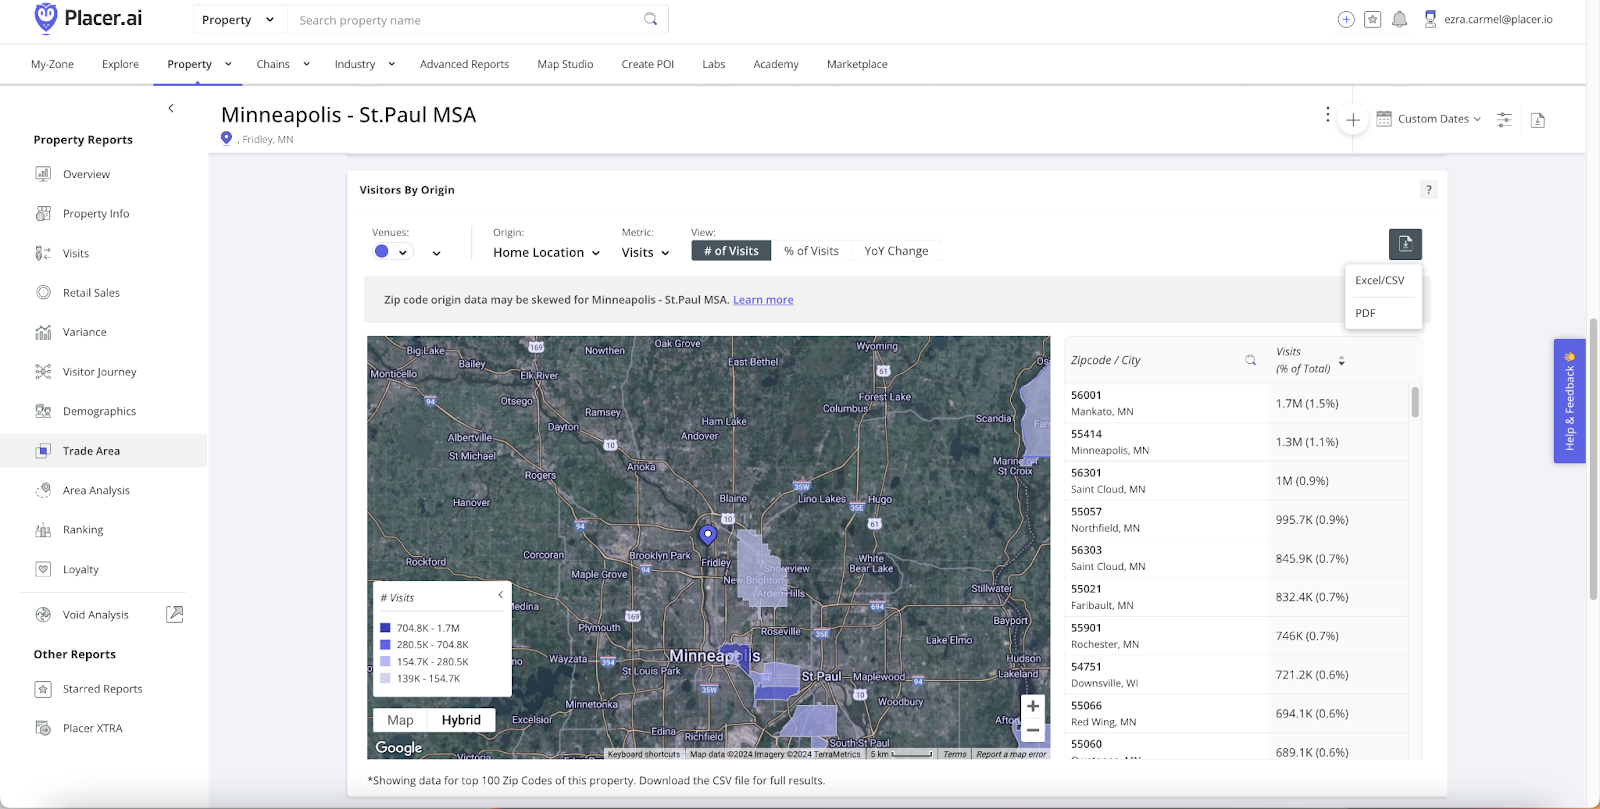
A concentration of visits from a cluster of zip codes could indicate demand for air service from that region to your airport.
Learn more about Visitors by Origin
Step 4: Explore the Travel & Tourism Report: View travel demand between CBSAs
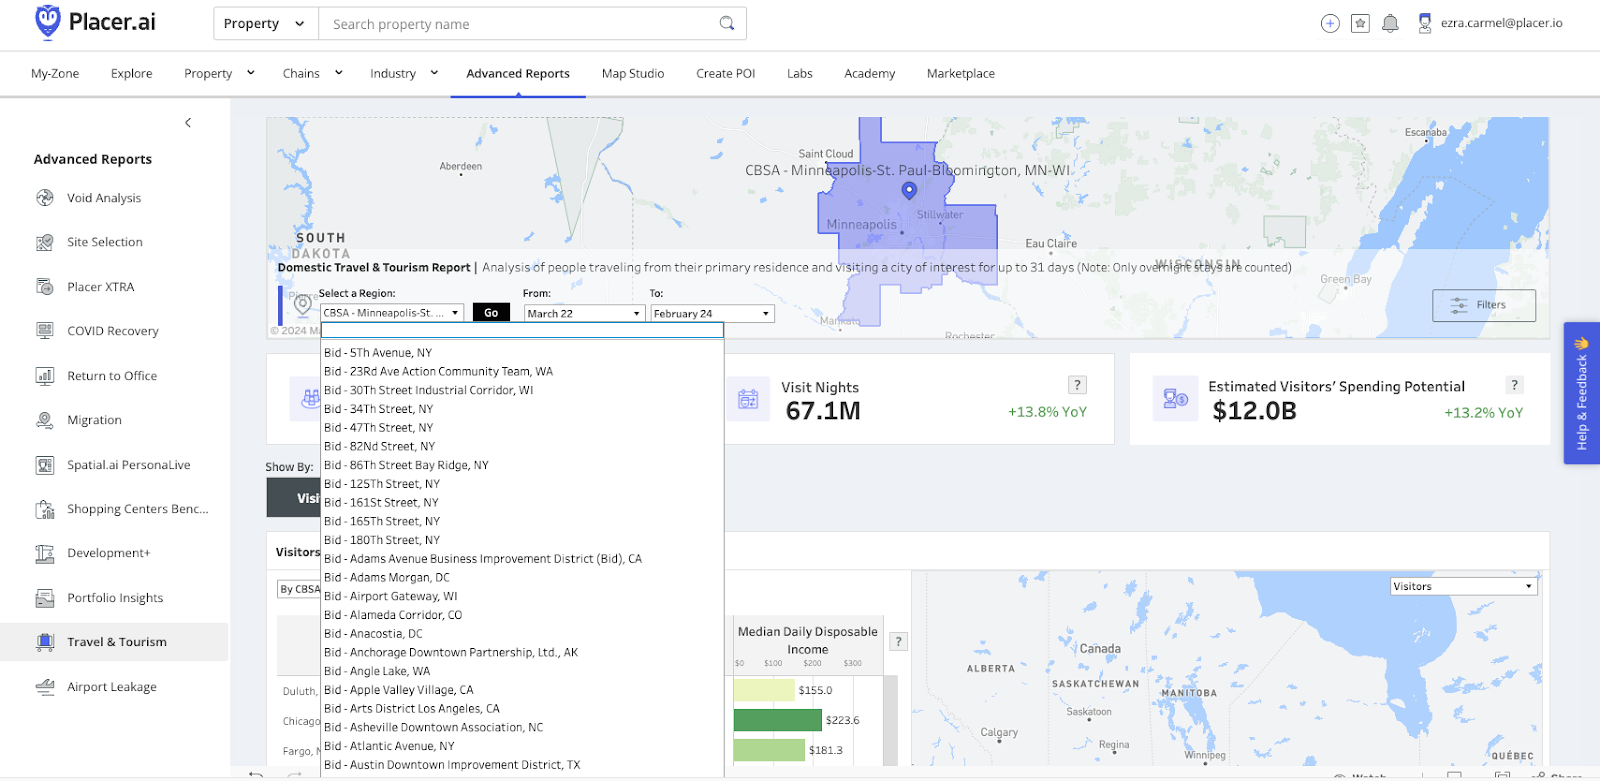
a. In the Advanced Report Tab, select the Travel & Tourism Report from the left sidebar. The Travel & Tourism Report provides an analysis of people traveling from their primary residence to another region for an overnight stay of up to 31 nights.
For this example, Minneapolis - St. Paul International Airport (MSP) is exploring service to Punta Gorda Airport (PGD) in Charlotte, County, FL and Orlando International Airport (MCO).
b. Select the Minneapolis-St. Paul-Bloomington, MN-WI CBSA from the regions dropdown menu and adjust the desired timeframe. Click GO.

Pro Tip: New monthly data is available in the Travel and Tourism report several weeks after month’s end.
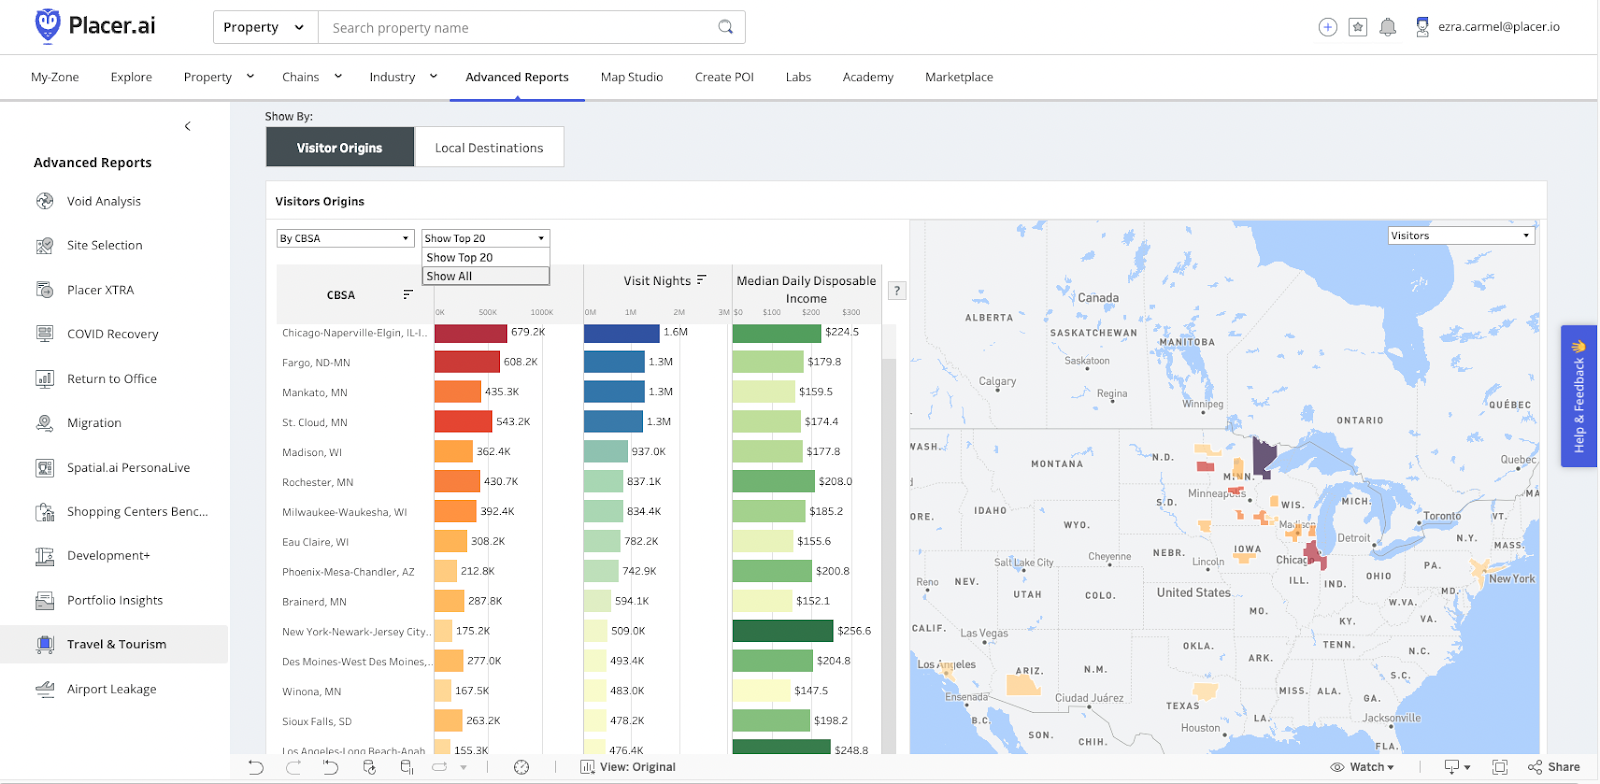
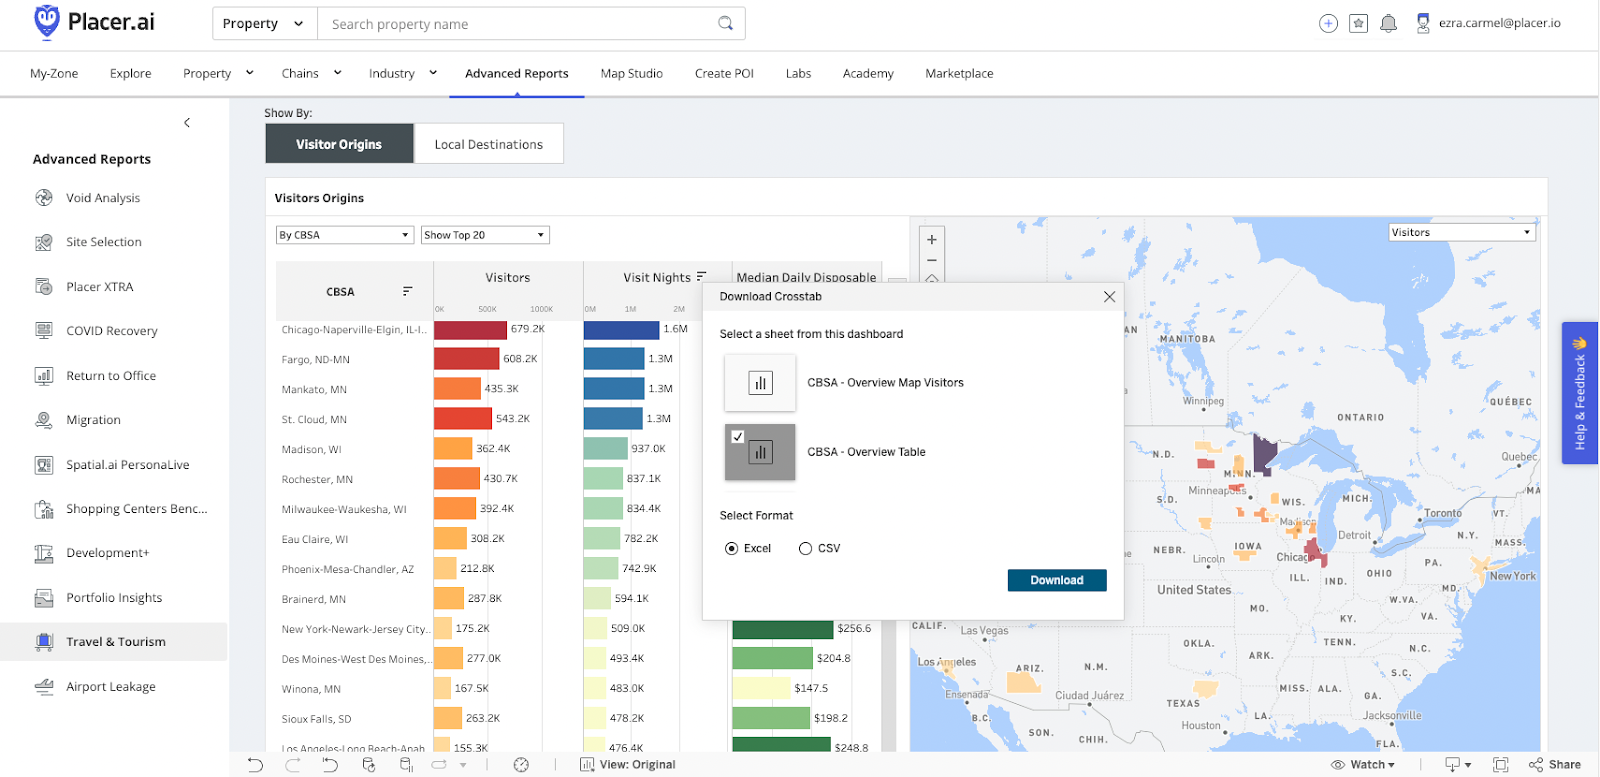
c. Scroll to the Visitor Origins widget. From the second dropdown menu select Show All.
d. Download results using the Crosstab download bottom in the bottom-right corner.
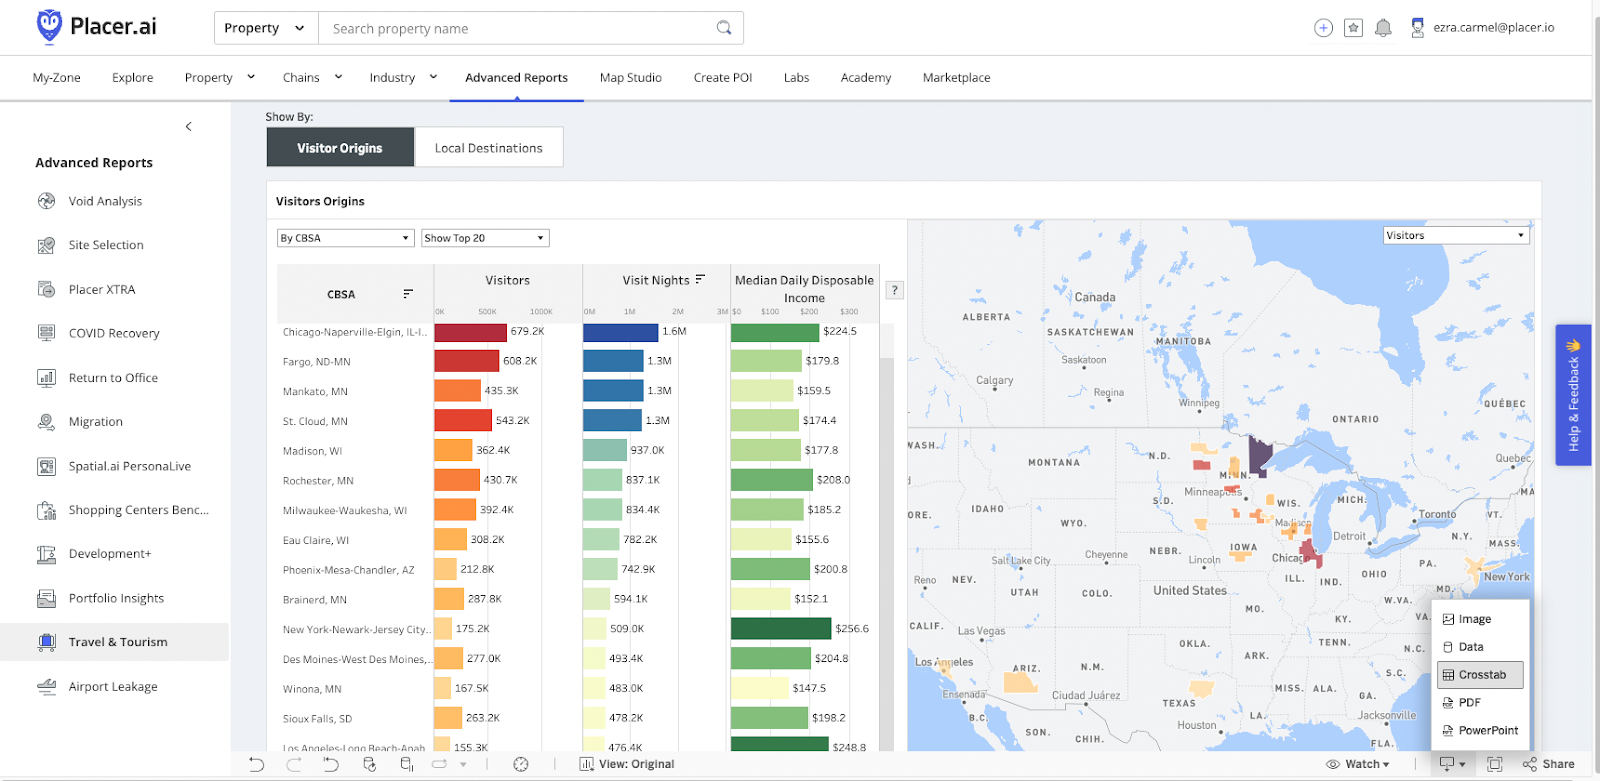
e. Select CBSA - Overview Table as Excel or CSV format to download a comprehensive list of the number of visitors to the Minneapolis-St. Paul-Bloomington, MN-WI CBSA from other CBSAs.
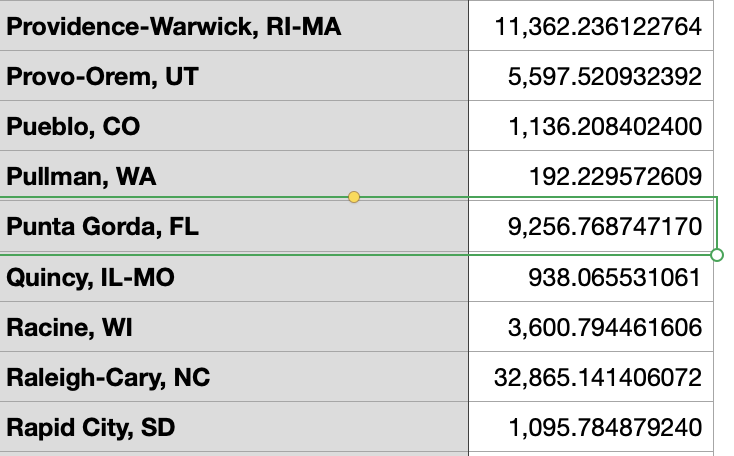
f. In the downloaded file, search for the CBSA with the airport you are considering service to. You now have the number of visitors from that CBSA to your airport’s CBSA during the timeframe you selected, that may be interested in a direct route.

Learn more about Travel & Tourism Report
You can also reference our previous webinar recording on this topic: