
.jpg)
Placer’s platform contains many powerful tools and features that help you to understand what’s really happening in the physical world. The Placer Academy, with the help of step-by-step guides, instructional videos, and real-world case studies on key use cases, was created to help you master the platform. This quick start guide will help you get started using the platform and highlight a few reports worth exploring right away.
You’ll be able to answer these questions after reading this article:
- How do you search for a specific point of interest (POI) and request to add a new one?
- How do you export a property report?
- How do you see foot traffic metrics and pull demographic information?
Get started with the following steps:
Step 1: Search for a specific POI
a. After logging in, you will be brought to the Explorer view, which is an interactive map of the United States.
.jpg)
b. To navigate to a specific POI you have three options:
i. Drag the map and zoom into the location.
ii. Use the upper search bar if you know the specific POI name (red box).
iii. Use the lower search bar if you have the POI address (green box).
.jpg)
c. Once you find the POI you’re looking for, if it’s verified, you’ll be able to open a Property report by clicking on Open Report and then Property.
.jpg)
d. If the POI is unverified and the Property report section is grayed out, you’ll need to request that the POI be added through the Help & Feedback section on the right side.
.jpg)
Step 2: Request a POI to be verified & added to the platform
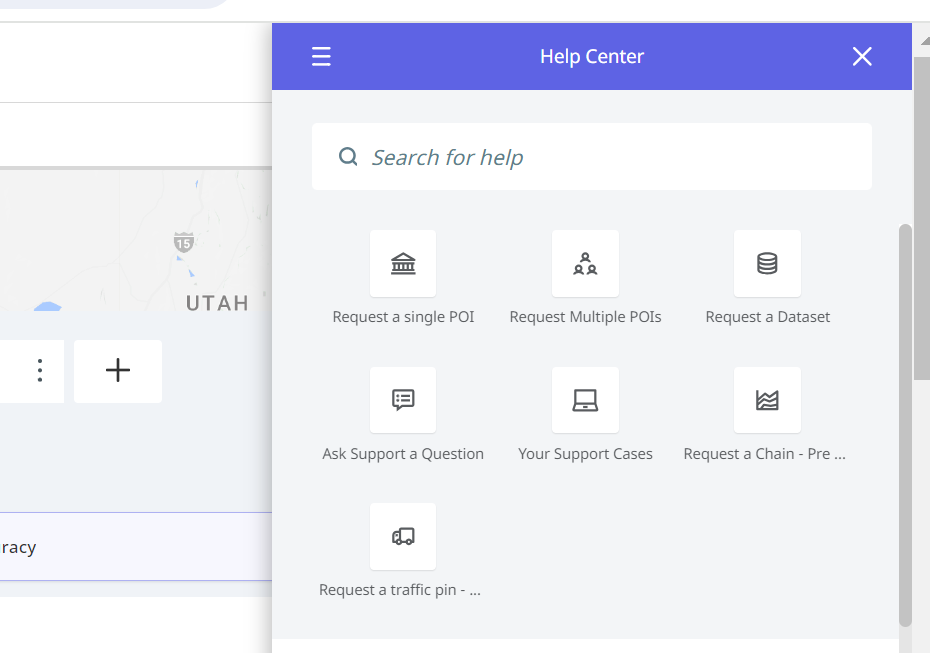
a. To request a POI, click on Help & Feedback in the middle right side of the screen.
.jpg)
b. If you only have a single location to request, choose "Request a Single POI". Continue to step C below.
NOTE: if you have a list of POIs to request, choose "Request Multiple POIs" -from here, download the blank template. Fill in details for all requested locations (name, full street address) and save as a CSV. Come back into the "Request Multiple POIs" button, and submit the spreadsheet by Adding File.
IMPORTANT: lists of over 15 POIs will get added into a batch queue for small bits of weekly work until the ticket is completed. Please check with the Support team for details on ETA. Length of time to complete will depend on numbers of overall POIs requested, complexity and the current Support caseload.
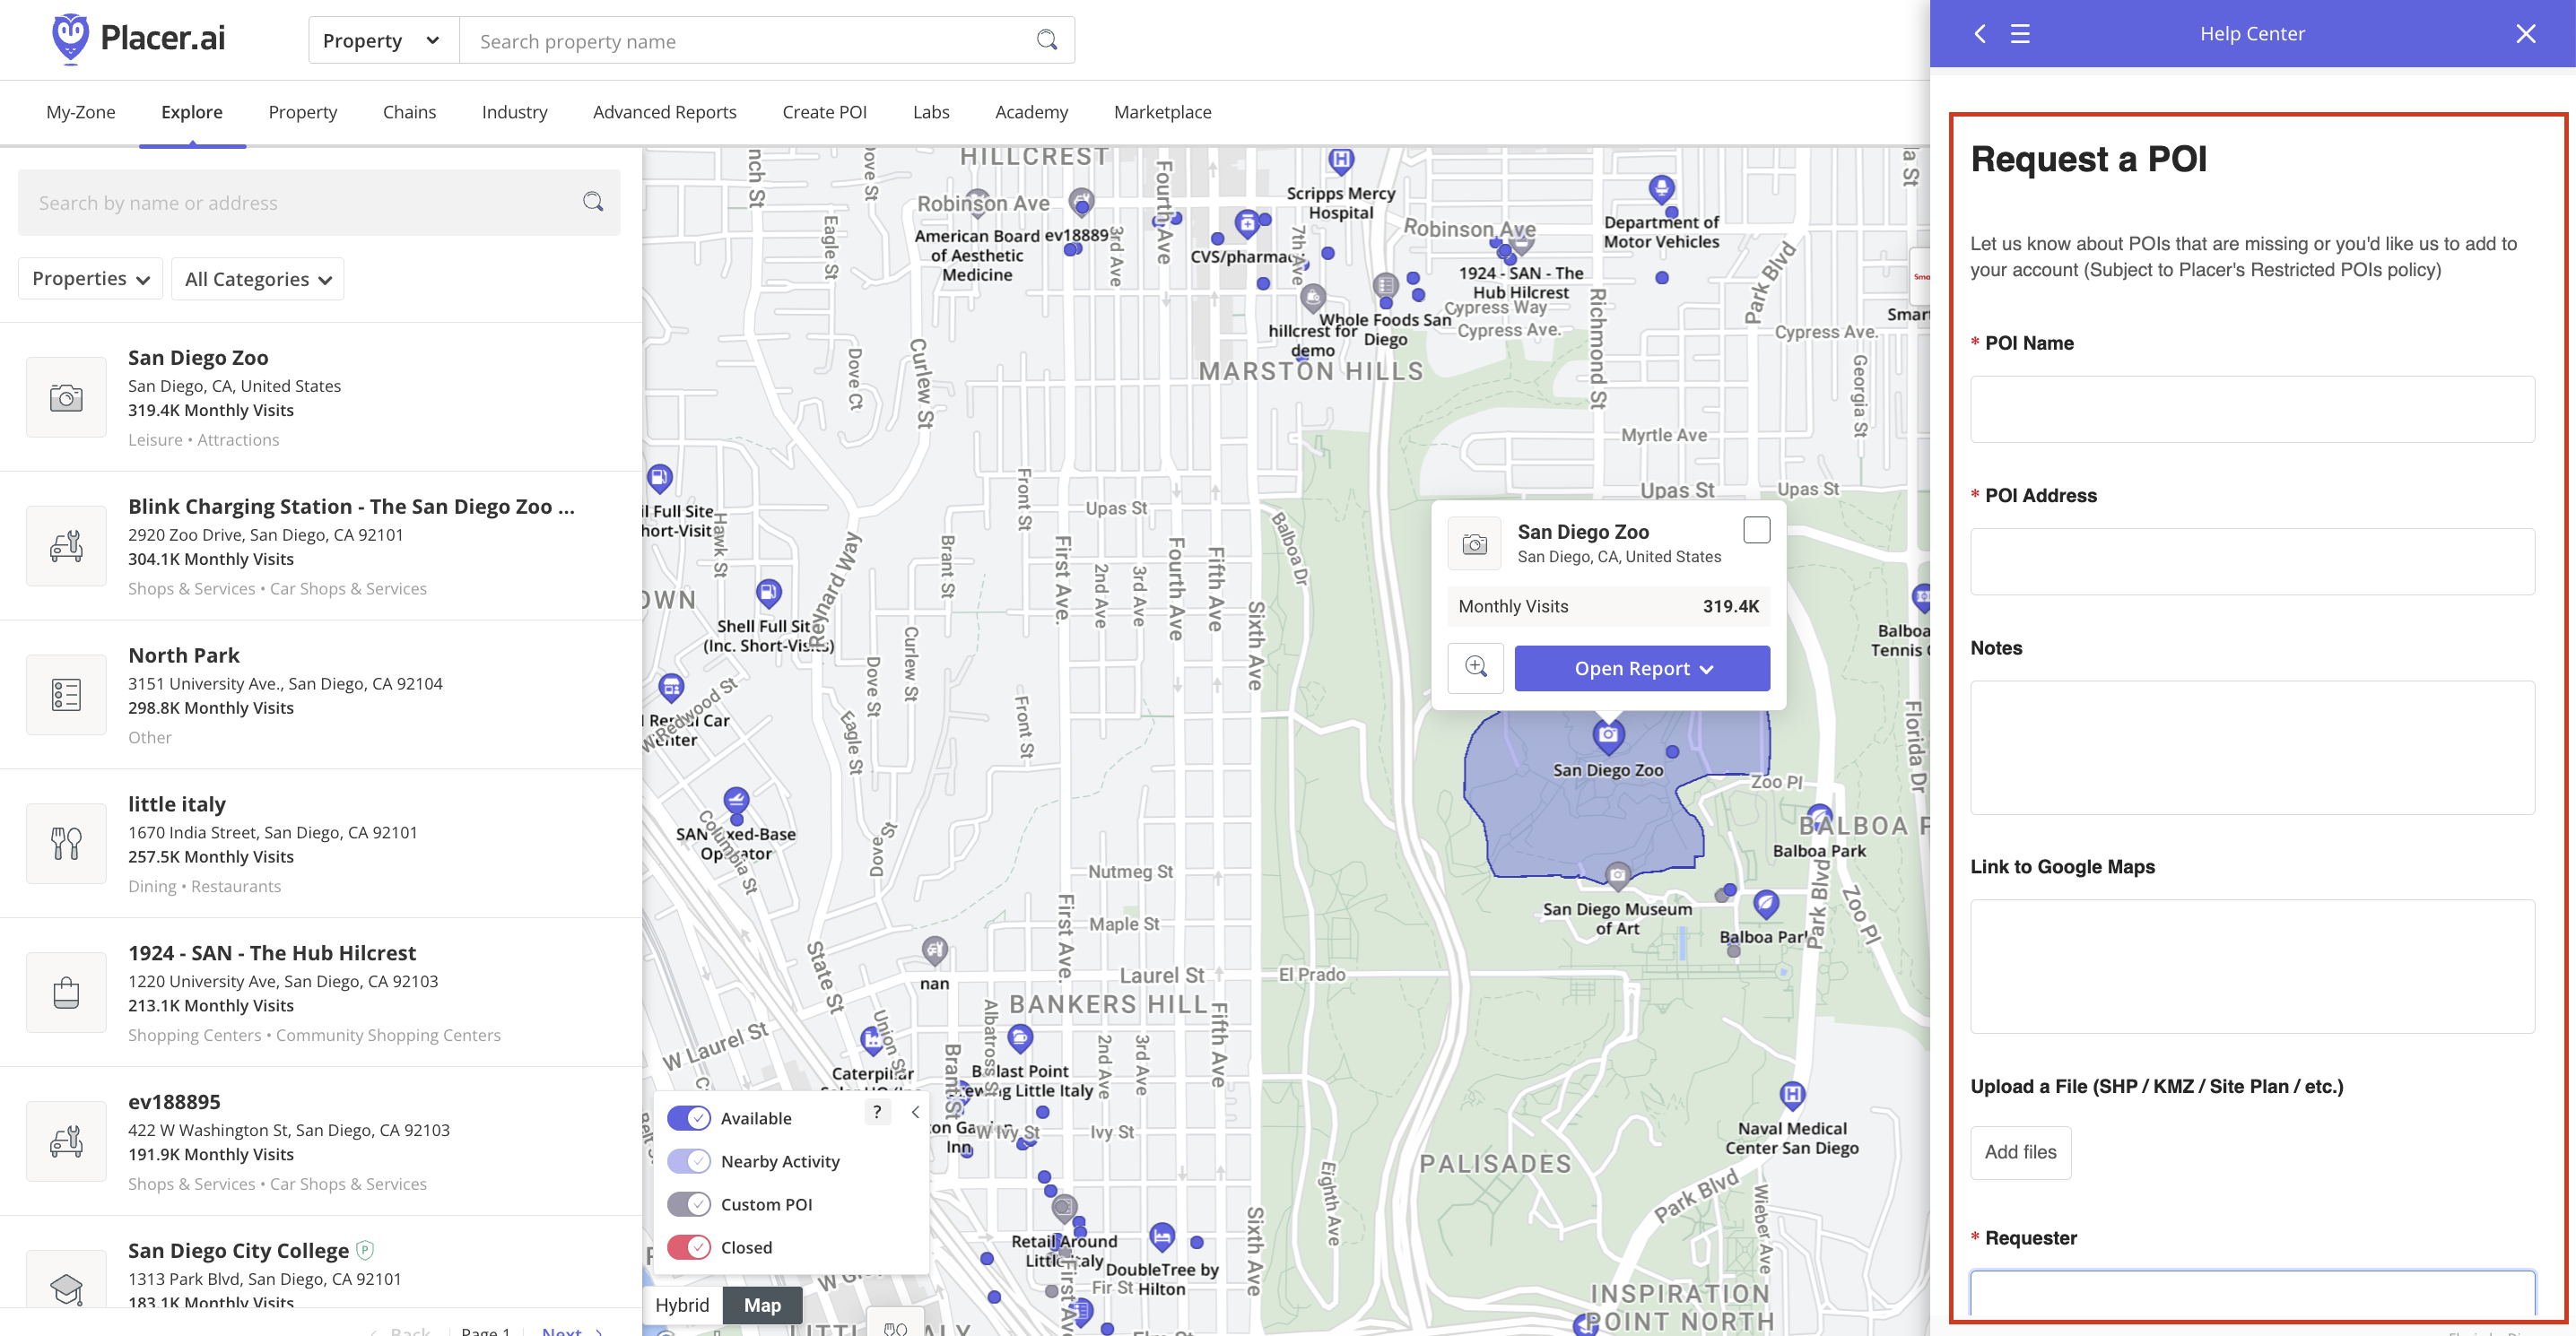
c. Fill in the following information:
i. POI Name: This is the name of the POI you would like to add to the platform.
ii. POI Address: This is the full street address of the POI.
iii. Notes: This is any additional information about your request that may be helpful.
iv. Link to Google Maps: This link is optional, but is preferred to help verify locations.
v. Upload a File: Optionally, you may also choose to upload a file that describes the location (e.g., SHP, KMZ, Site Plan, etc.) This is not required for many location types but may be helpful. If you have a larger area or want a custom geofence, please contact your CSM for more instructions.
vi. Requestor: This field will be populated by the email address of the logged-in user. This is where all updates regarding your request will be sent.
d. Click submit and your request will be sent to support. Please note that it can take between 3-5 days for a POI to be verified. If you want more information, particularly if you’d like to submit more than 15 locations or submit a request for Traffic Pins, please contact your CSM for help.
The Custom POI Creator can be used to quickly add a POI if you need data immediately. However, custom POIs are not verified by the Placer team, so they cannot be used in rankings, chains, and various other tools – and the margin of error on estimates for custom POIs is higher than verified POIs. Learn about Custom POI Creator
Step 3: See foot traffic metrics
a. Once in a Property report, select the date range you want to look at.
.jpg)
b. Below the date range, there is the Metrics section. This displays how many unique visitors and total visits your POI received in the selected time frame. If you have questions about what each is, Click on “?” in the upper right corner. Every report widget has this explanation in the same location.
.jpg)
c. Directly below metrics, look at Visits Trend. This shows a POI's overall health over a day, week, or month (you can change this by clicking where the red box is).
.jpg)
d. Next, look at Ranking Overview to see how the POI ranks.
.jpg)
Learn about Ranking Overview
e. Explore the other metrics on the Overview report and decide what’s relevant for you.
Step 4: Export data from the Property Report
a. To export the data, scroll to the top of the page, click Export, and then Customize.
.jpg)
b. Once complete you can export your report as a PDF (red box) or click “Generate URL Link” (green box) and it will make a web address that you can send to anyone. This URL will remain valid for 30 days.
.jpg)
Step 5: Pull demographic information
a. Click on the Demographics tab and scroll down to browse the audience data provided, including ethnicity and household income.
.jpg)
b. View the Audience Profile widget at the top. Select different types of trade areas, including True Trade Area, Drive Time, and Distance in Miles (red box). You can choose from a large collection of datasets to analyze visitor attributes (green box). Select a dataset and explore the demographic attributes provided in the table below. Also, choose between Captured Market (Census Block Groups weighted by number of visits when calculating the audience profile) and Potential Market (Census Block Groups weighted by population size when calculating the audience profile).
.jpg)
Learn about Trade Area
c. You may also download your report as a PDF or CSV. If you choose PDF, you will see the same menu as when you download the Overview report. If you choose CSV, it will download directly to where you have your browser downloads set to go.
.jpg)
For more information on trade areas, watch Trade Area & Demographics Training.