
%20(1).jpg)
Community leaders need to measure the success of specific businesses and public venues within a city or region in order to make the best decisions. Analyze the reach and visitor draw of specific businesses or locations within your community, understand visitation data within their trade areas, and rank specific venues and businesses by reach and foot traffic.
You’ll be able to answer these questions after reading this article:
- How can you identify the top visited places in your community?
- How can you compare the health and vitality of different businesses, shopping centers, neighborhoods, or public venues?
- How do you analyze trade areas to understand reach and visitor draw?
- How can you evaluate the health and popularity of districts, neighborhoods, and specific public places such as shopping centers, parks, hubs, and tourist centers?
Get started with the following steps:
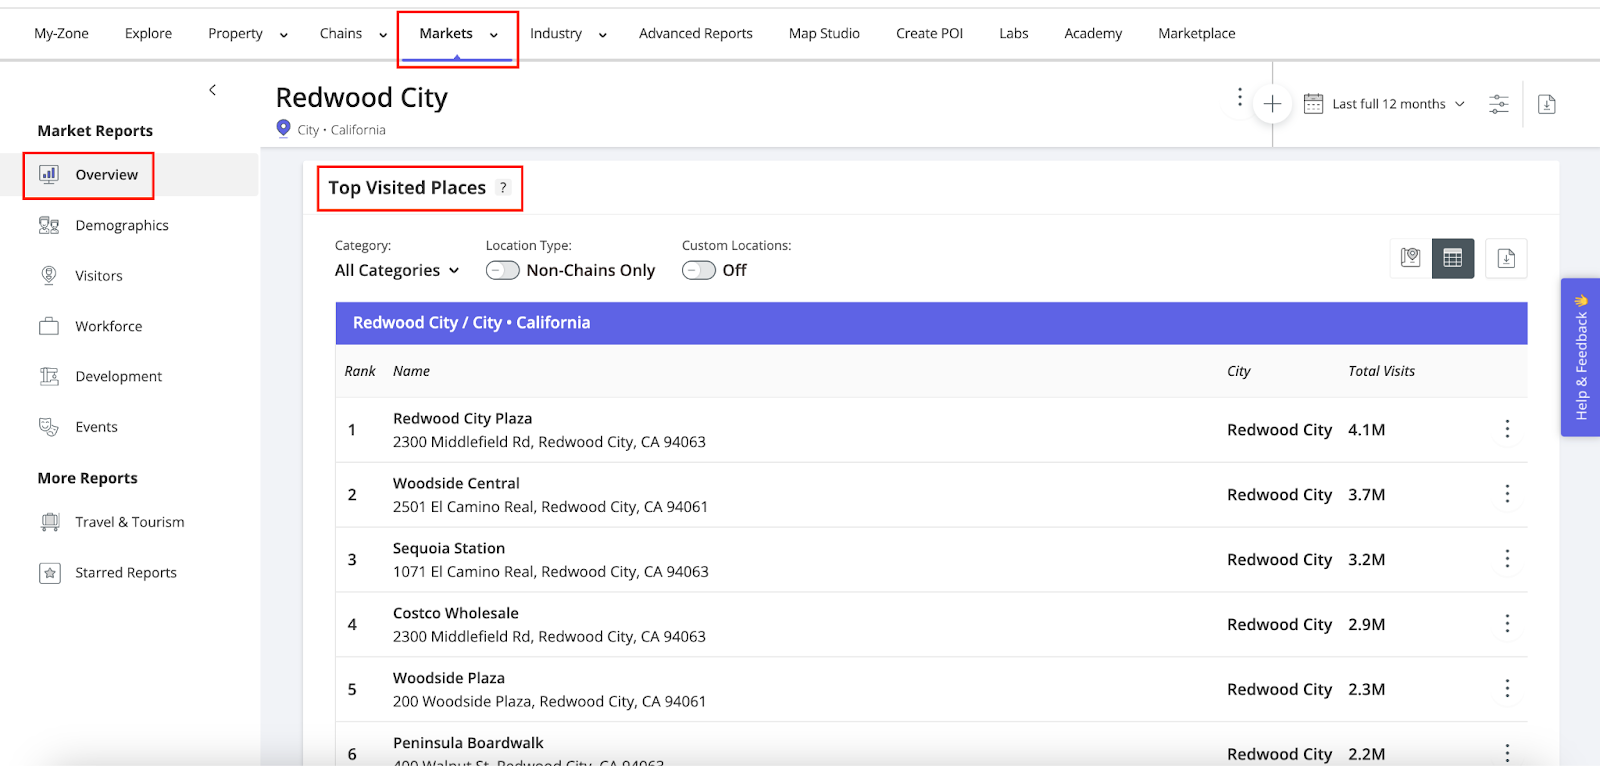
Step 1: Review Top-Visited Places to identify the most popular spots among your market audiences
Pro Tip: The reports and widgets available in the Markets section may vary per account.
a. From the Markets section of the platform, navigate to Overview in the left sidebar.
b. Scroll to the Top Visited Places widget to see the most frequently visited locations in the market for your selected date range. The list includes popular destinations across all audiences (Residents, Employees, and Out-of-Market Visitors).
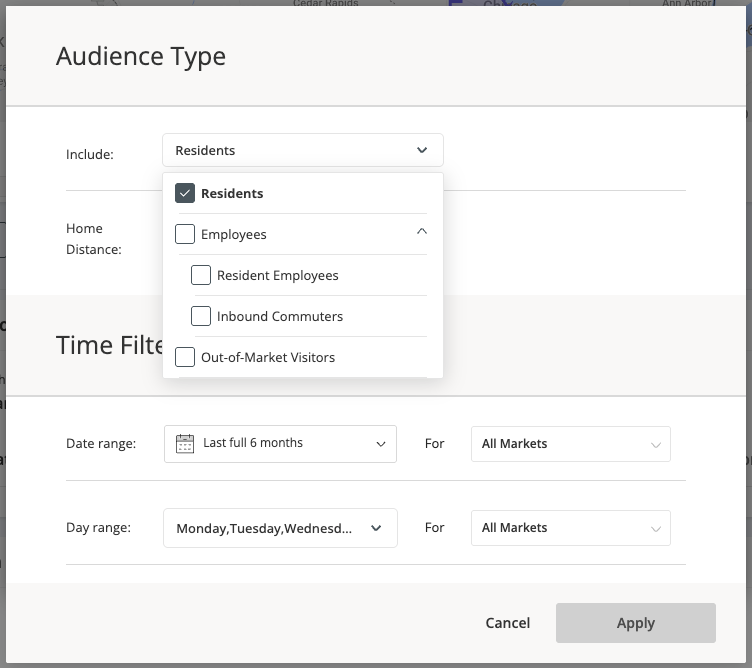
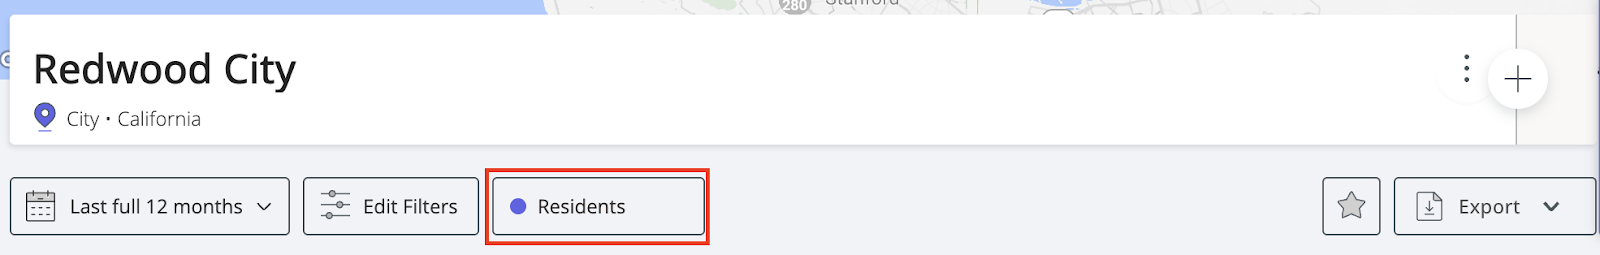
c. To analyze the top visited locations for a specific audience group, use the Add Filters option at the top of the Overview report to select your desired segment. In this example, we’ll focus on Residents.
d. You can also apply additional filters (category, in/out of market locations, location type) to focus on the places most relevant for your business needs.

Step 2: Analyze and compare visitation data to locations throughout your community
a. Navigate to Explore and type your POIPoint (Location) of Interest. into the search bar. Up to 8 POIs can be chosen at one time by checking the empty white box next to your POI in the center of the page or on the left sidebar. The number of POIs selected will appear at the bottom of the left sidebar. Once the POIs are selected, click Open Report and select Property. This will open the Property report.
.jpg)
b. Adjust the dates to any custom range. Reports will default to the last 12 months, so you can click the calendar icon and choose the preferred date range, then click Apply. For example, analyze and compare data side by side for multiple shopping centers within your community. Look at the estimated number of customers and visits (Metrics), the visit trends (Visits Trend), the performance of specific locations (Ranking Overview), visits at any time of day (Hourly Visits), visits by day of the week (Daily Visits), and how long visitors remain (Length of Stay).
.jpg)
Learn about Foot Traffic Metrics
Step 3: Show a location’s reach and visitor draw by analyzing trade areas
Navigate to Trade AreaRepresentation of the dispersion of home and work locations that drive traffic to any venue. in the left sidebar. Understand your visitors’ True Trade Area (Trade Area) and see the distance in miles required for visitors to reach the property (Trade Area Coverage by Distance). Filter by visitors’ home or work location, and by visit frequency to understand the travel patterns of more loyal visitors.
.jpg)
Learn about Trade Area Coverage by Distance
Step 4: See how businesses and venues within your community rank
a. Navigate to Ranking in the left sidebar and view the performance of existing businesses or venues you want to evaluate (use the plus icon to add a location and click Go).
b. You can rank these locations against others in the same category or you can rank an existing business against its chain. You can also rank using total Visits or Visits per Square Foot.
c. You will see the POI’s rankings at the national, state (including options for DMA or CBSA), and local mileage ring granularities.
.jpg)
d. The Ranking Index section at the bottom of the page allows for a filtered view of the ranked locations.
.jpg)
.png)
.jpg)