

Understanding a market’s audience composition and trends is essential for making informed strategic decisions to better serve the local economy or boost tourism to the region. With Placer’s Market insights, you can analyze audience activity, uncover top visited locations, and explore demographic trends to gain a deeper understanding of who spends time in a market and how their behaviors evolve. his article will help you analyze audience activity in the market and refine your analysis to derive the insights you need.
You’ll be able to answer these questions after reading this article:
- How can you analyze a market’s daily and hourly activity to uncover key market trends?
- How do you identify the most popular locations among your market’s audience?
- What insights can you gain about visitor demographics across different audience segments?
Pro Tip: The reports and widgets available in the Markets section may vary per account.
Get started with the following steps:
Step 1: Analyze audience activity to gauge market dynamics and uncover key trends.
Gain a clear understanding of the market’s audience composition—how residents, inbound commuters, and out-of-market visitors behave in the market throughout the day and week.
a. Begin by analyzing the Overview report in the Markets section.
b. View Market Population Metrics to get a quick snapshot of audience counts during the report period and gauge market activity at a glance.

c. Scroll to see audience activity by hour or day to compare how residents, employees, or out-of-market visitors engage with the market, identify peak activity times, and uncover patterns that can inform business strategies, event planning, and resource allocation.
d. Hourly Activity shows how visitation fluctuates throughout the day, helping you identify peak and low-traffic periods. Daily Activity reveals how visitation traffic varies by day of the week, highlighting patterns in high and low-traffic days.
- Residents – See what times of the day and day of the week locals are most active, helping businesses and municipalities plan services, retail operations, and community events.
- Inbound Commuters – Identify peak commuter times and workplace lunch/dinner rushes to optimize business hours, optimize staffing throughout the week, and transit planning.
- Out-of-Market Visitors – Understand when tourists and other visitors are present in the market to optimize services and draw visitation.


Step 2: Review the Top-Visited Locations to identify the most popular spots among your market audiences
a. Choose your desired audience segment at the top of the Overview report by clicking Add Filters. In this example, we’re focusing on the market’s Residents.


b. View the Top Visited Places widget to identify the most frequented locations in the market for the selected audience segment within the chosen date range.
c. You can apply additional filters (category, location type) to focus on the places most relevant for your business needs.

d. If you want to focus on the Employees audience segment, adjust the audience filter at the top of the report or navigate to the Workforce Report in the left sidebar and locate the Employees' Top Places widget.

e. Here you can refine your audience analysis by viewing the top places employees visit within your selected market, outside of it, or both. Understanding these patterns gives a complete view of employees' routines, enabling businesses to tailor offerings, optimize site selection, and refine marketing strategies by identifying key locations where employees spend time outside the workplace.

f. If you want to focus mainly on your market’s visitors, navigate to the Visitors Report in the left sidebar and locate the Visitors’ Top Places widget. Here you can also refine your list of top locations to be based within the market, out of the market, or both. These insights help tourism efforts by refining marketing, improving service offerings, and pinpointing high-traffic areas to identify key growth opportunities.

Step 3: Analyze demographics across different audience segments for any market.
a. To dive into audience attributes open the Demographics report in the left sidebar.
b. Here you can view a snapshot of audience demographics based on different 3rd party datasets including Census and STI Popstats. Attributes like median household income, average number of individuals per household, and most common ethnicity are all broken down for each audience segment.
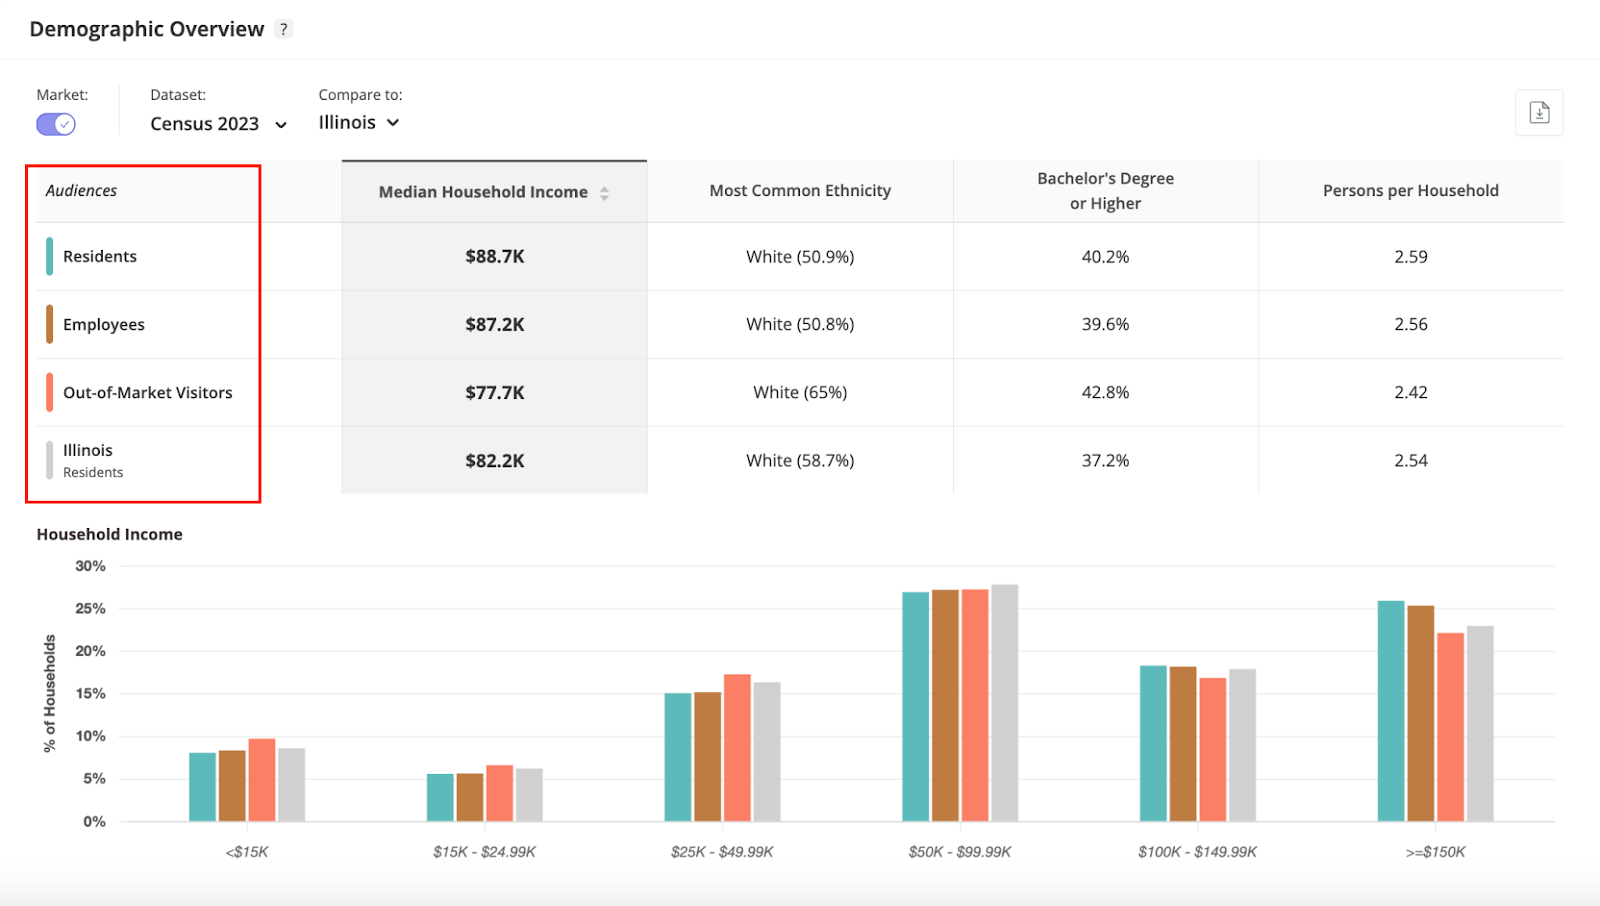
c. The different audience types (residents, employees, out-of-market visitors) are benchmarked against the state demographics, however, you can also toggle on the nationwide view to compare your market to the nationwide average.

d. Additionally, you can scroll down to the Demographic Profile section for psychographic insights from various datasets, offering a deeper look at the market’s residents, employees, and out-of-market visitors. For example, STI: Spending Patterns highlights consumer spending across categories, while AGS: Behavior & Attitudes reveals preferences, values, and lifestyle traits.

Step 4: Review changes to visitor demographics over time using the Quick Compare function
This feature lets you compare the same market side by side with different filters in place.
a. Click the three dots in the market’s header bar, select Quick Comparison, then click Go to open the market side-by-side. To compare multiple time periods, click the plus (+) icon to add the same market again.


Learn about Quick Comparison
b. From your new report view, click Add Filter. We’re looking at 2022 vs 2023 vs 2024, so choose Filter per Market on the right, and then choose the custom ranges you want to use in each case. Highlight the custom date ranges and click Apply. Choose Apply again at the bottom of the section.

c. Now, you can visualize the shifts in demographics across the various time periods. In this example, we are looking at the audience segment of out-of-market visitors and their median household income. See how the average income for this group has steadily increased over the 3-year period.

d. You can analyze the demographic attributes by audience segment (residents, employees, out-of-market visitors) to better understand who is present in your market and how they differ.
