.png)
Understanding where travelers come from and what draws them to your market is key to optimizing local strategies and enhancing tourism efforts. With Placer’s Market Visitor Report insights, you can explore detailed visitation metrics, determine how far visitors travel, and identify the key attractions that drive them to a specific market. From examining visit frequency to uncovering visitor origins and hotspots, this article will help you understand the full picture of visitor movement in your market.
You’ll be able to answer these questions after reading this article:
- How can you use Placer visitation metrics to analyze visit frequency in your market?
- What insights can you gain about where visitors are coming from and how far they travel to your market?
- How can you identify key attractions and hotspots that are drawing visitors to your market?
- How do you see where visitors are traveling before and after visiting a specific market?
Pro Tip: The reports and widgets available in the Markets section may vary per account.
Get started with the following steps:
Step 1: Review Placer traffic metrics to compare visit frequency and understand who’s spending time in your market
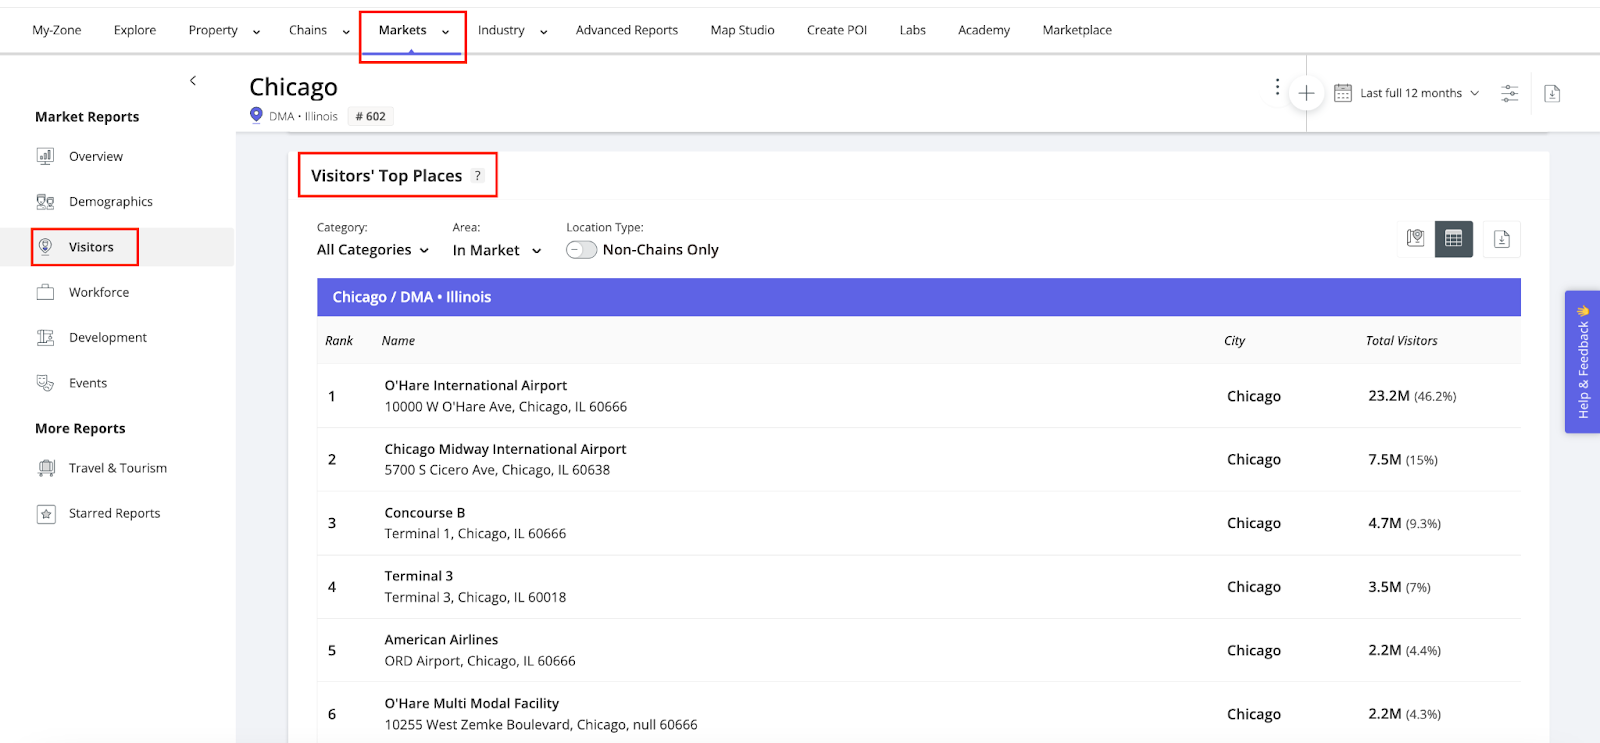
a. In the top navigation bar, select the Markets section to run a report for a market of interest, then navigate to Visitors in the left sidebar.
b. Review key Visitation Metrics, offering insights into visitor volume, behavior, and trends within your market.
c. You can assess Visit Frequency to help gauge visitor loyalty and engagement, and YoY Change to track trends in visitor volume (with green (+) indicating growth and red (-) showing a decline).
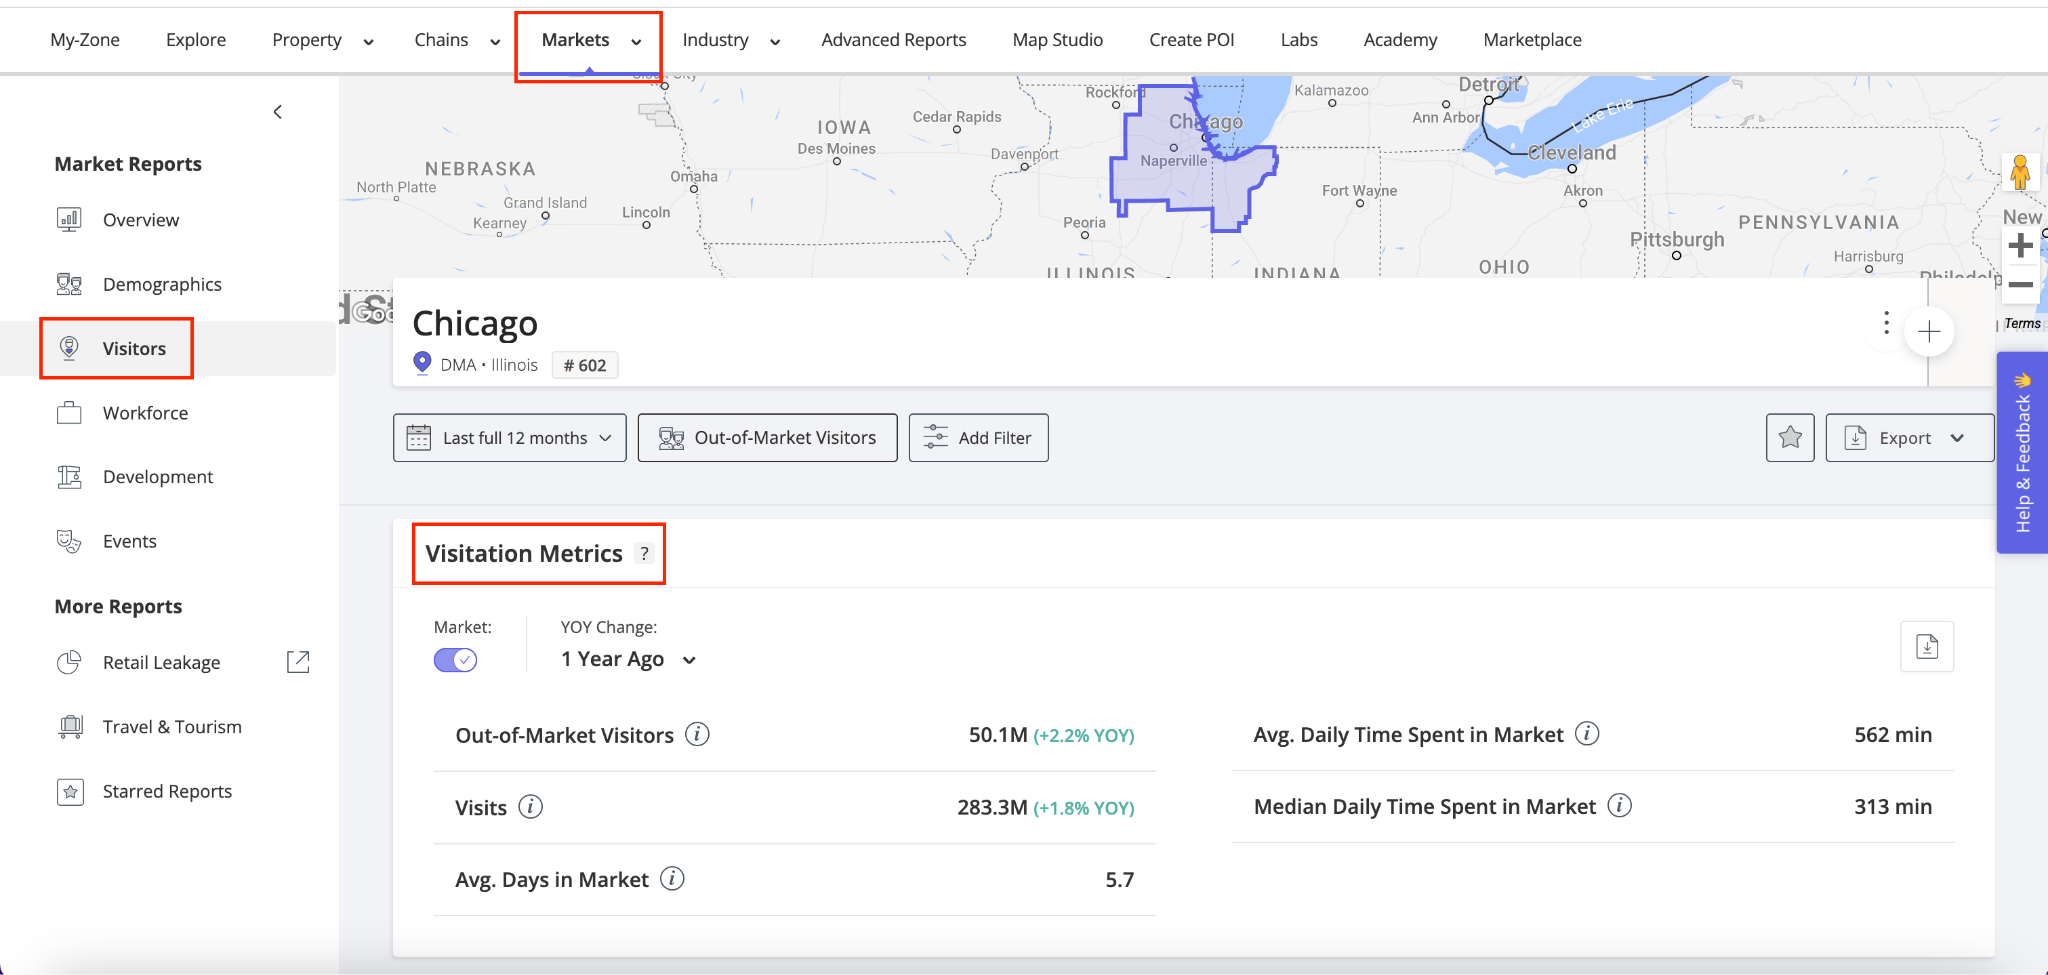
By leveraging these metrics, you can compare travel and tourism trends over time, identify opportunities to attract and retain more travelers, and refine strategies to enhance visitor experiences in your market.
Step 2: Determine Visitor Origins and how far they travel to your market
Understanding where your visitors come from and how far they travel can help refine destination marketing strategies, optimize outreach efforts, and enhance regional planning.
a. Scroll to the Visitor Origins widget and see where your out-of-market visitors originate based on their home locations.
b. Use percentage metrics to understand the share of visits and visitors from each region, and track shifts in visitor origins over time with YoY Change insights.
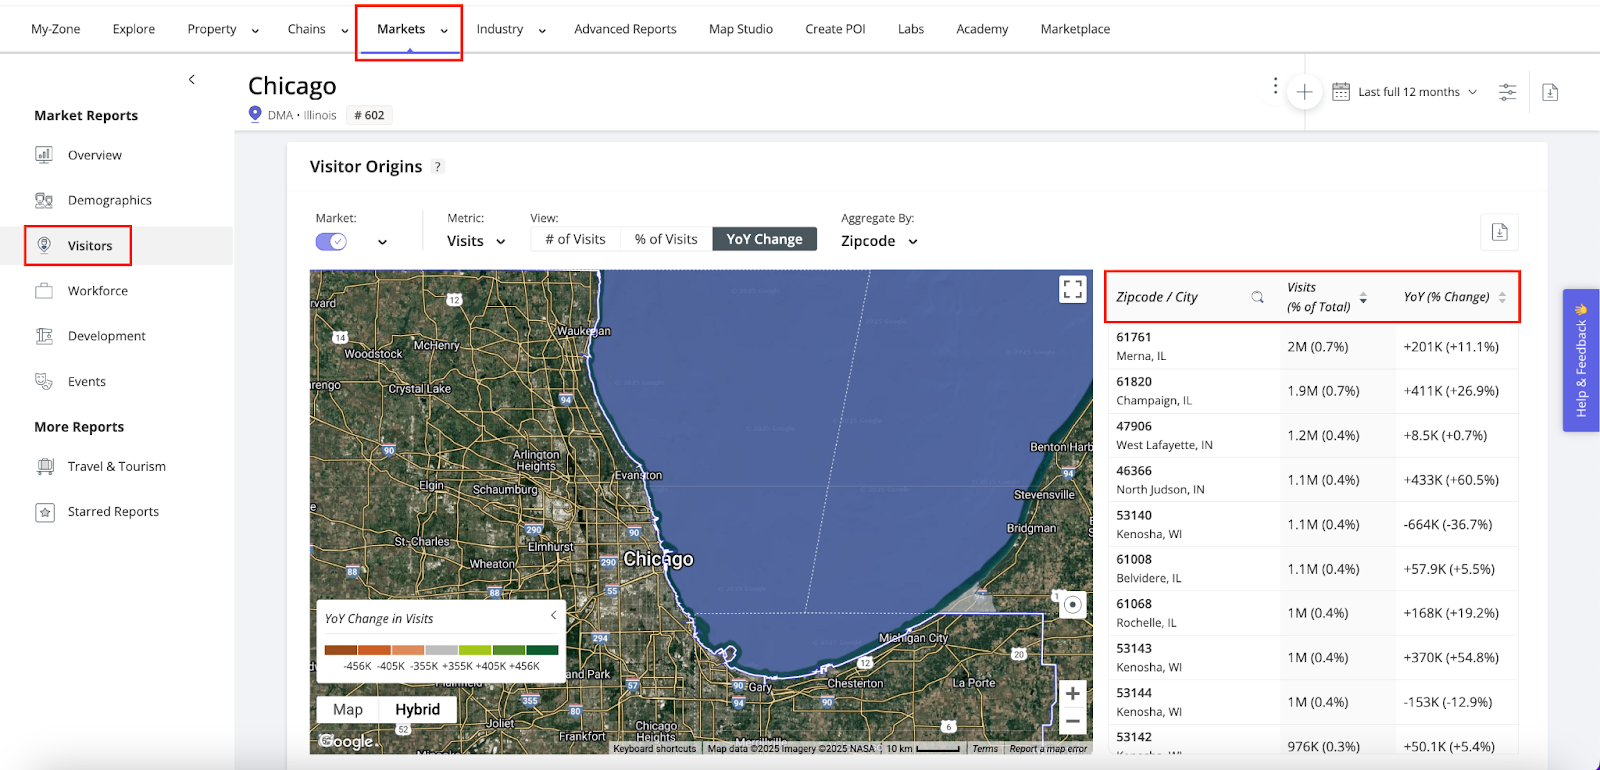
c. The interactive map and table highlight top regions (zipcode, DMA, County, State), helping you:
- Target high-potential areas – Identify the regions sending the most visitors to your market.
- Optimize marketing campaigns – Focus advertising and promotions on regions with a strong visitor presence.
- Support municipal planning – Inform local policies and infrastructure projects based on travel patterns.
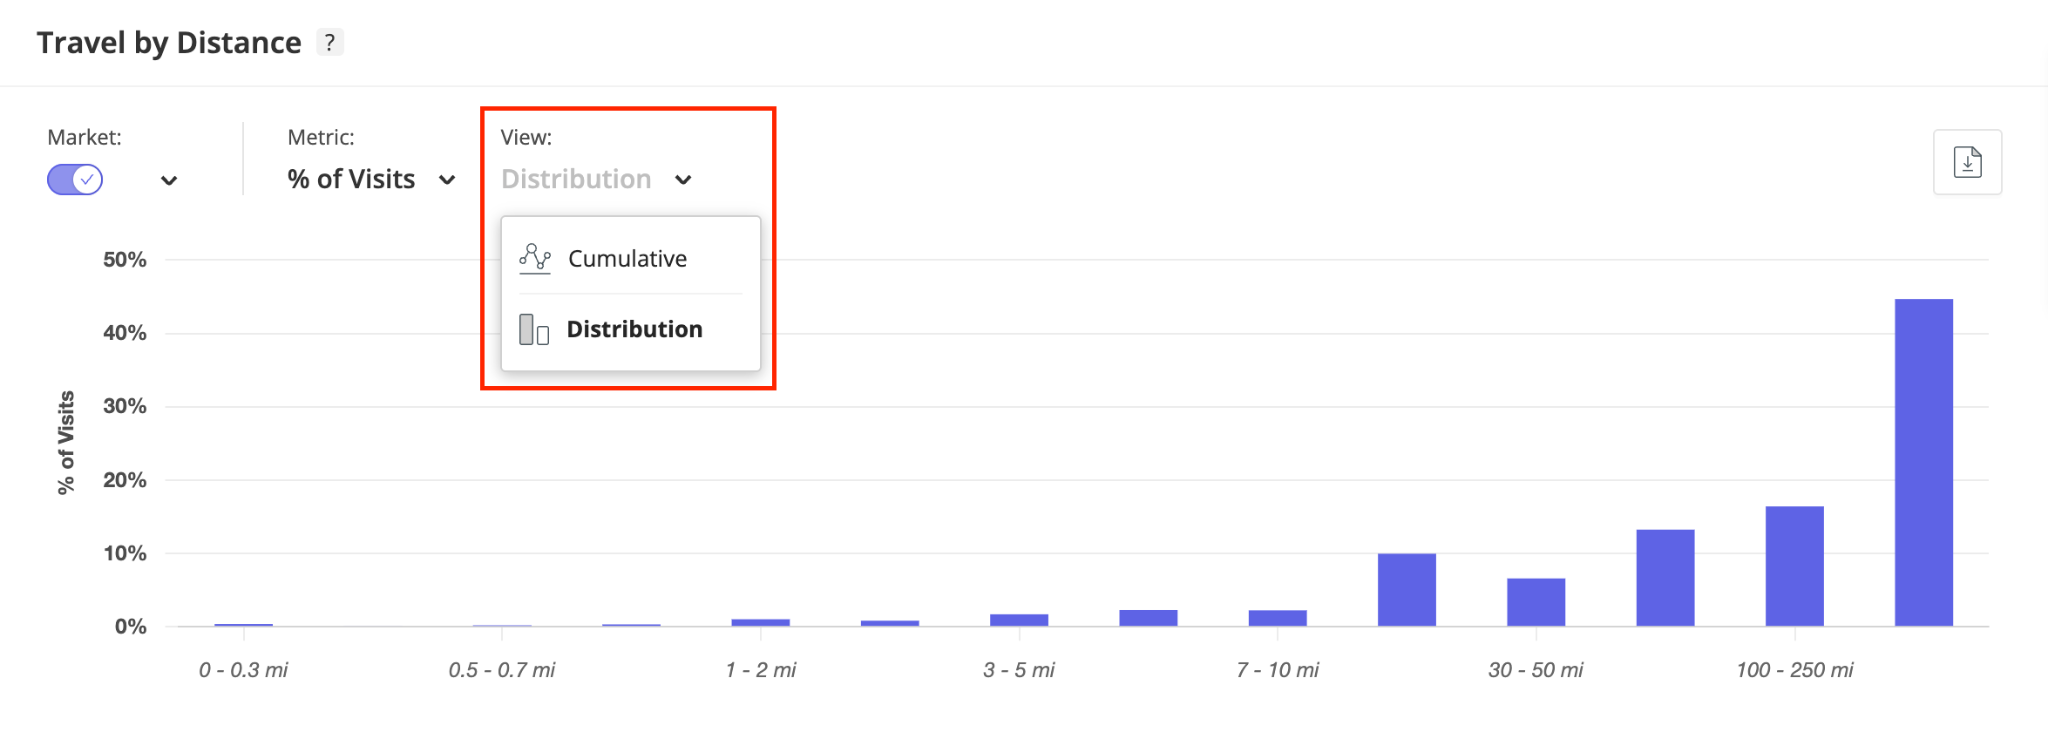
d. Scroll to the Travel by Distance tool to see how far out-of-market visitors travel to reach your market. By analyzing these patterns, you can assess your market’s reach, determine whether visitors are primarily local or long-distance travelers, and refine your audience targeting to align marketing efforts with visitor behavior.
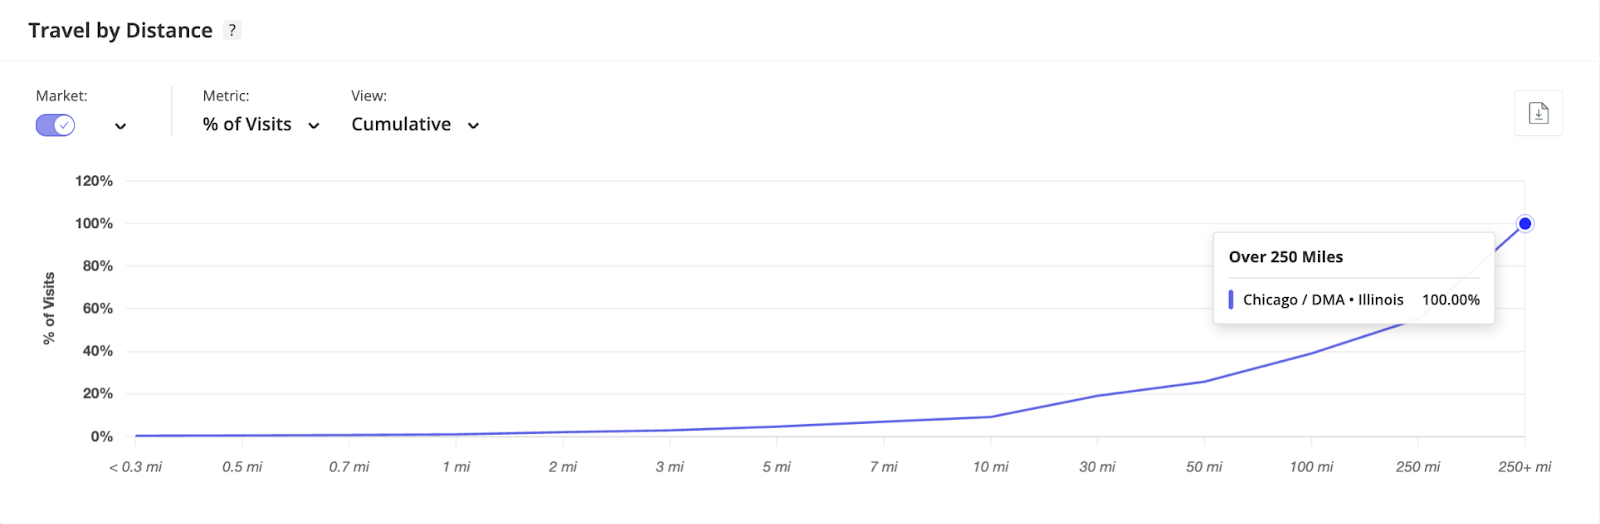
e. Visitor travel distances can be analyzed using two views: Cumulative, which shows the total percentage within a given range (e.g., 70% travel within 50 miles), and Distribution, which breaks down visitors by specific distances (e.g., 15% travel 1–2 miles).
Step 3: Discover what attracts visitors to your market: where visitors stay, shop, and dine
a. Within the Visitors Report in the left sidebar, scroll to the Visitors' Top Places widget.
b. Visitors' Top Places provides an in-depth look at the most popular destinations within a chosen market over a specific date range, helping you uncover the top locations that are influencing visitor traffic in your market.
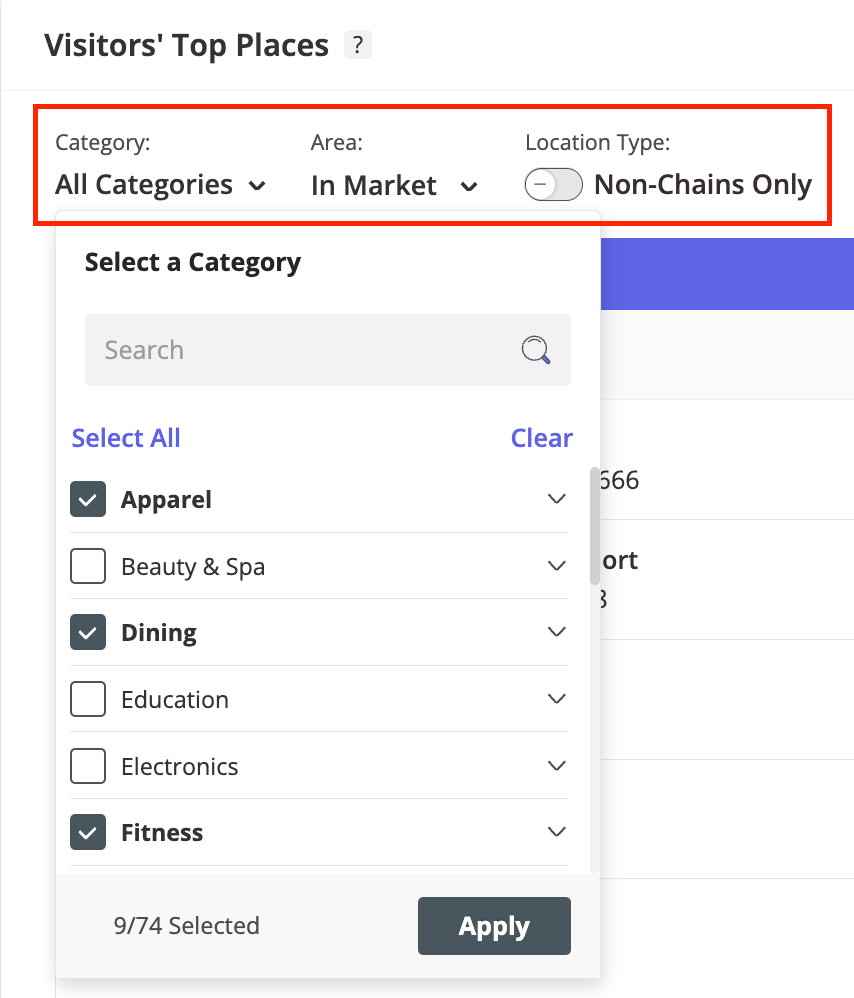
c. You can refine the list of locations by category, location type, and filter by those within your market, outside your market (highlighting retail leakage), or both. These viewing options help reveal key trends and inform strategies to enhance tourism and visitor engagement in your market.
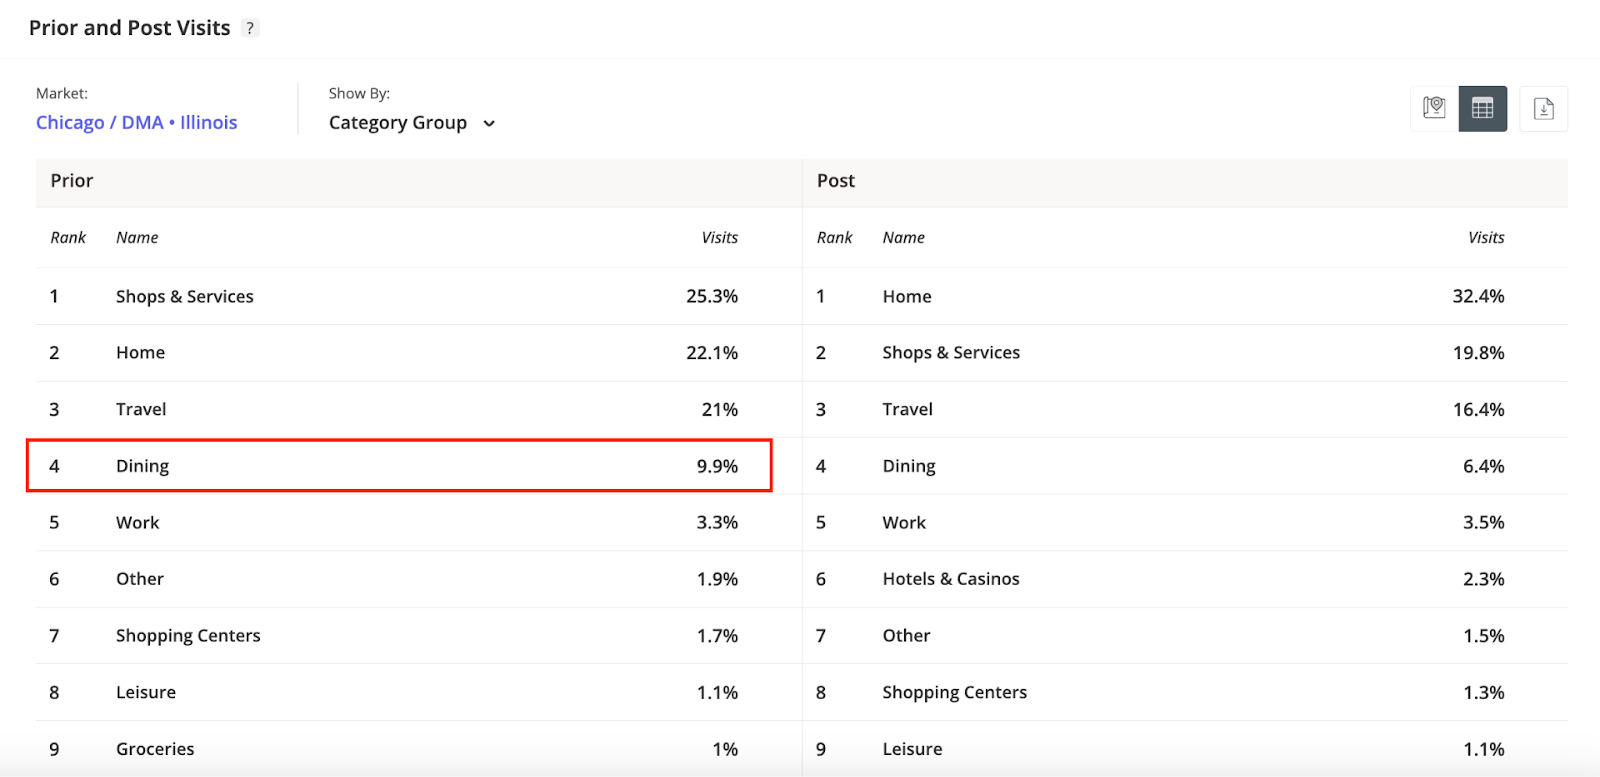
d. You can also leverage the Prior and Post Visits data to gain insights into visitor behavior surrounding your market, uncovering where they go before and after their visit.
e. Scroll to the Prior and Post Visits widget and see the locations and categories visited, along with the percentage share of visits relative to the total prior or post visits. For example, you can see that 9.9% of visits before arriving in your selected market were to dining locations.