

Before committing your resources to any event sponsorship, it’s important to thoroughly assess its value.
Specifically, it's essential to validate the event’s reach and analyze the event’s audience. Placer can help you understand visitor draw, demographics, interests, and journey for any annual or otherwise repeating event, so you can ensure that the event aligns with your business objectives and resonates with your own target audience.
After reading this article, you’ll able to answer the following:
- How many visitors did this event receive in previous years?
- Where do visitors to this event live?
- What are visitors to this event like? What is their age, gender, interests, and purchasing power?
Get started with the following steps:
Step 1: Identify the POI associated with the event.
a. Locate an existing POI associated with the event you are evaluating. For example, select the arena, venue, or address that housed the event in previous years.
b. If you are unable to locate the POI, you may need to request that a POI be added. Visit the Getting Started Guide for detailed steps on searching for or requesting a POI.
Step 2: Use Quick Compare to evaluate previous event performance.
Quick Compare allows you to view the same POI side-by-side, with different filters in place.
a. Open the Placer report for the POI, navigate to the three dots in the POI header bar, and click Quick Comparison. Immediately click Go to Report before adjusting any filters - this will open the same POI side-by-side.
b. From your new report view, click Add Filters. Choose Filter per Venue on the right and then choose the dates during which the event last occurred. Choose Apply at the bottom of the section.
Learn about Quick Compare
Step 3: Quantify event attendance and reach.
a. Under Overview Reports, review the data presented in the “Metrics” widget to see the total number of visits, the number of individual visitors, visit frequency, and dwell time.
The example below shows visitation metrics describing Balloon Fiesta Park during the annual Albuquerque International Balloon Fiesta in both 2021 and 2022.

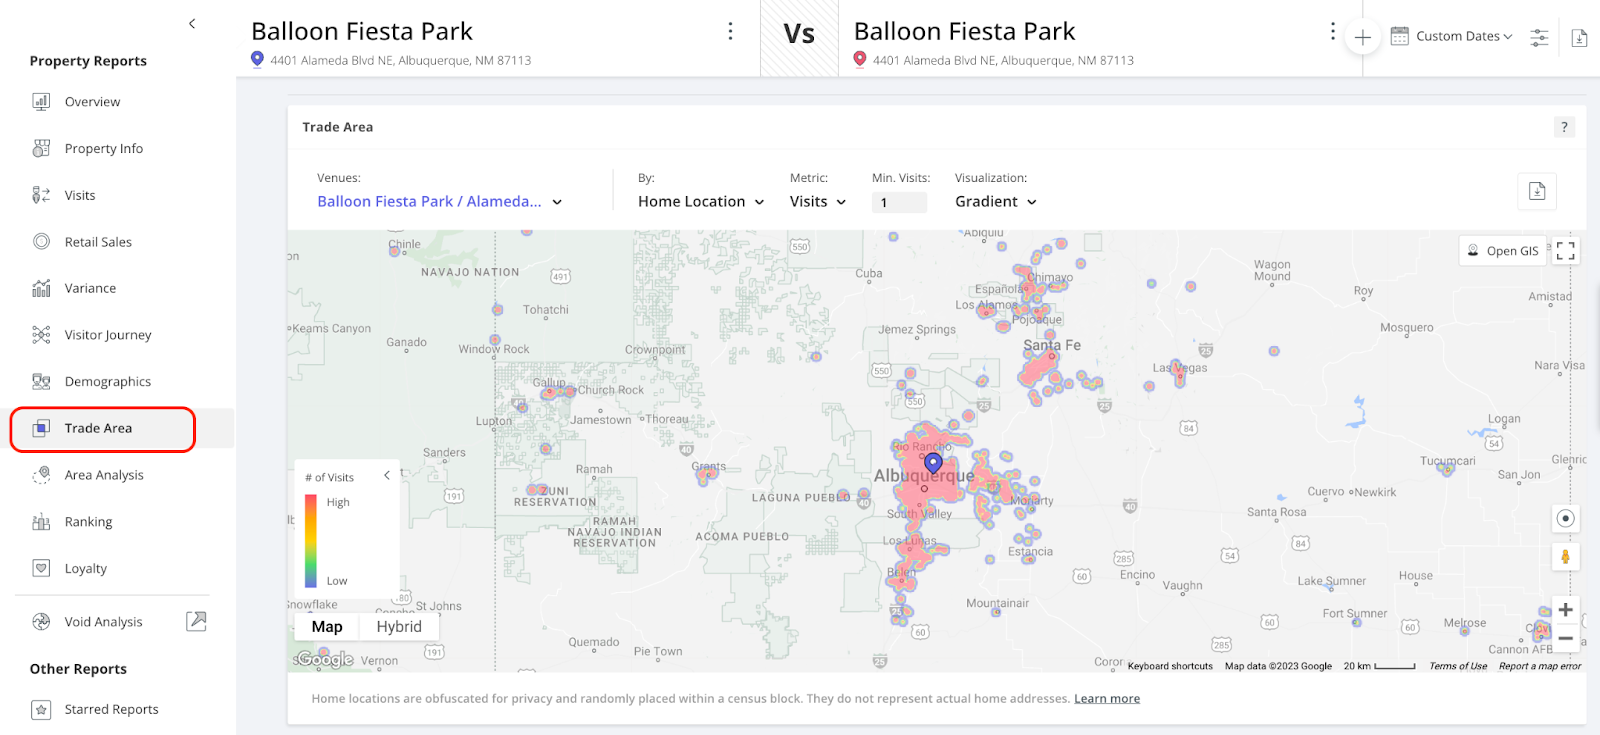
b. Navigate to Trade AreaRepresentation of the dispersion of home and work locations that drive traffic to any venue. on the left sidebar to view a map visualization of the trade area, which shows the geographic area from which the event draws its visitors, based upon where visitors live or work.
c. Scroll down further to view Visitors by Origin, which presents the top visit or visitor zip codes.

Step 4: Understand the composition of the event's audience.
Placer provides a wealth of information describing POI visitors –– including demographics, psychographics, spending preferences, and more. Navigate to the Demographic Reports to explore these insights and assess the degree to which the event’s attendees mirror your own target audiences.
To learn more analyzing audiences within Placer, visit the following:
- Analyze simple customer demographics for specific locations
- Perform in-depth consumer analysis for specific locations
Pro Tip: Customers with the Events expansion feature add-on can gain insights into sports games, conferences, festivals, and other events taking place around a store location. The new widget includes an interactive map showing historical events dating back to 2017, along with upcoming events scheduled for the next 12 months.
Step 5: For those who have added the Events expansion feature, contextualize visitation trends and fluctuations in foot traffic
a. Navigate to Area Analysis in the left sidebar and scroll to Events. Choose your time period and the distance from the property. Filter for the events you want to analyze and click on the map icons to see more information about each event.
b. Scroll down to see a summary of all the events that took place around your POI according to your parameters.
.jpg)