
.jpg)
Placer provides demographic information for any property or chain that is in our platform. In addition to providing the demographics of the people who come into your store or chain, we also provide the demographics of your trade area (Captured Audience vs Potential Audience). This is especially helpful if you want to know whether there is an opportunity to gain more customers of a certain demographic type, or if you want to know what demographic segment is really resonating with your brand.
After reading this article, you will be able to do the following:
- Understand the different types of demographics/psychographics that Placer offers
- Understand the demographics of a single store, a group of stores, or your entire chain
- Understand how to compare the demographics of people that come into your store against the demographics of the general population that lives in your trade area
- Understand how to compare demographics against competitors
- Understand how to compare demographics over time
Please note that demographic data is also available via data feeds and APIs, as well as visualized in GIS maps and XTRA reports.
What types of demographics/psychographics does Placer offer?
Placer offers demographics/psychographics across a range of different attributes
- US Census
- Standard demographics like HHI, ethnicity, education, household size, etc…
- Consumer Spend
- Audience segments based on how much people spend buying items
- Consumer Lifestyles
- Urban, suburban vs rural lifestyles
- Social media activity
- Career and professional attributes
- Family types (single, households with school aged children, empty nesters)
- Hobbies and interests
How to analyze visitor demographics for a single store, a group of stores, or a chain
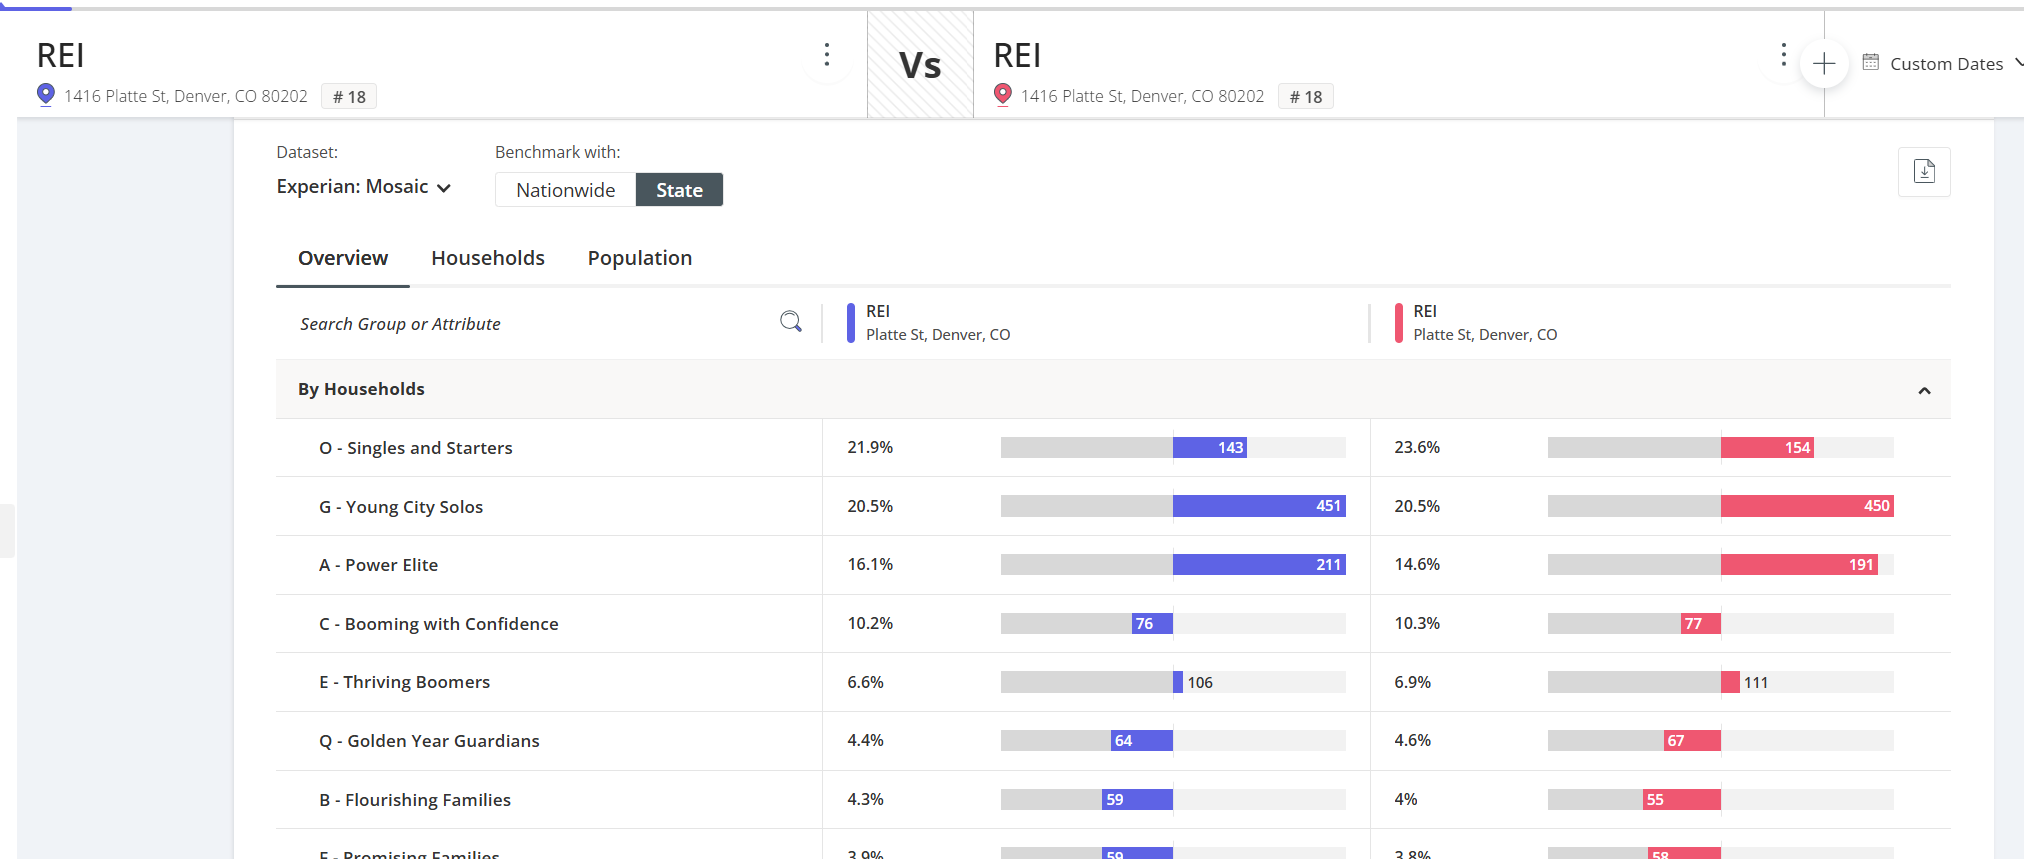
A. To analyze visitor demographics for a single store, find your store in the Property Report, and go to the Demographics section on the left.
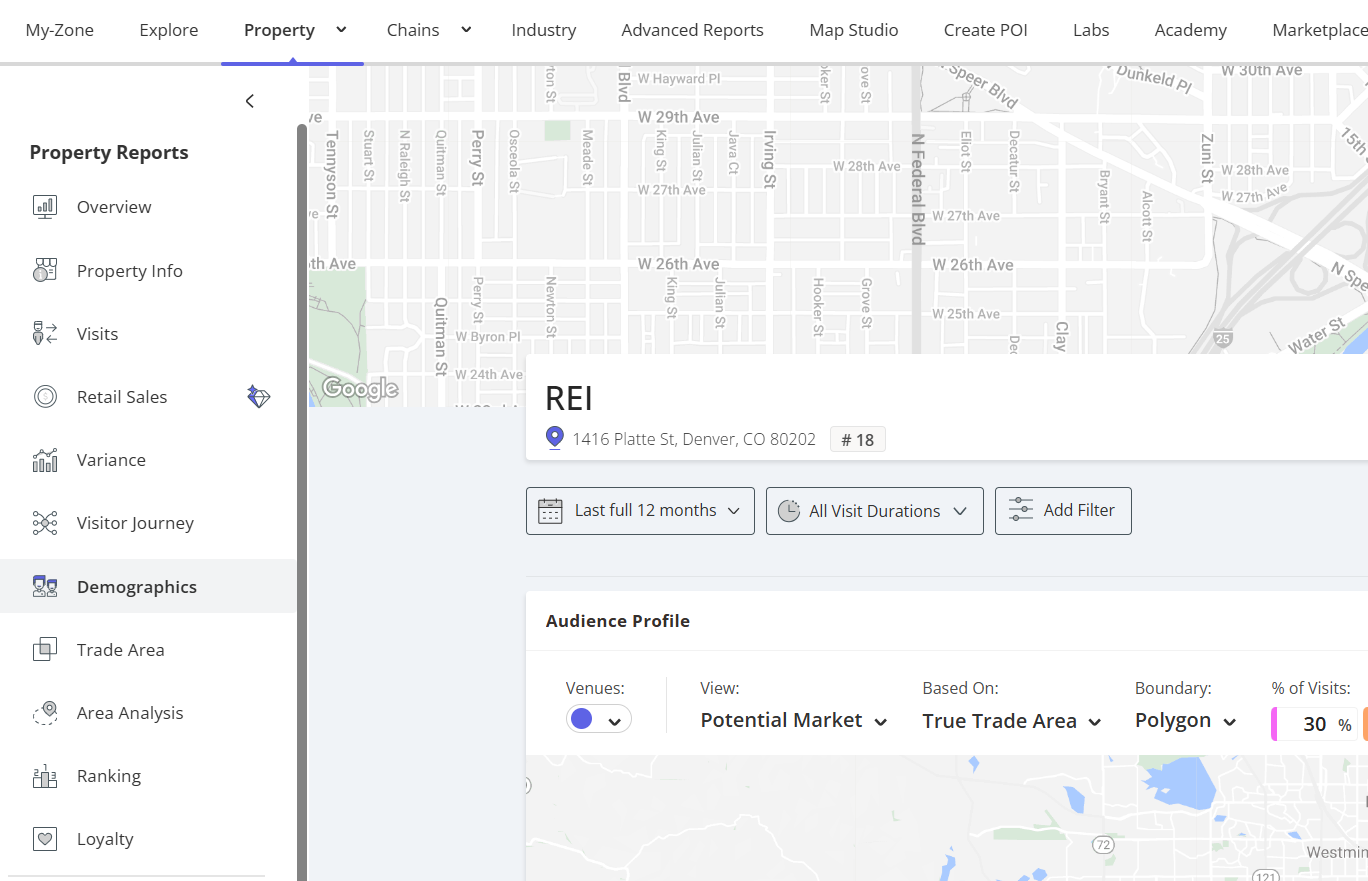
Under Audience Profile, select “View: Potential or Captured Market”, depending on your analysis needs & goals. Choose the trade area type of your choice (true trade area, distance in miles, drive time or walk time). Scroll down and select your “Dataset”.
Pro Tip: compare your demographic index against the State to be more granular than Nationwide.
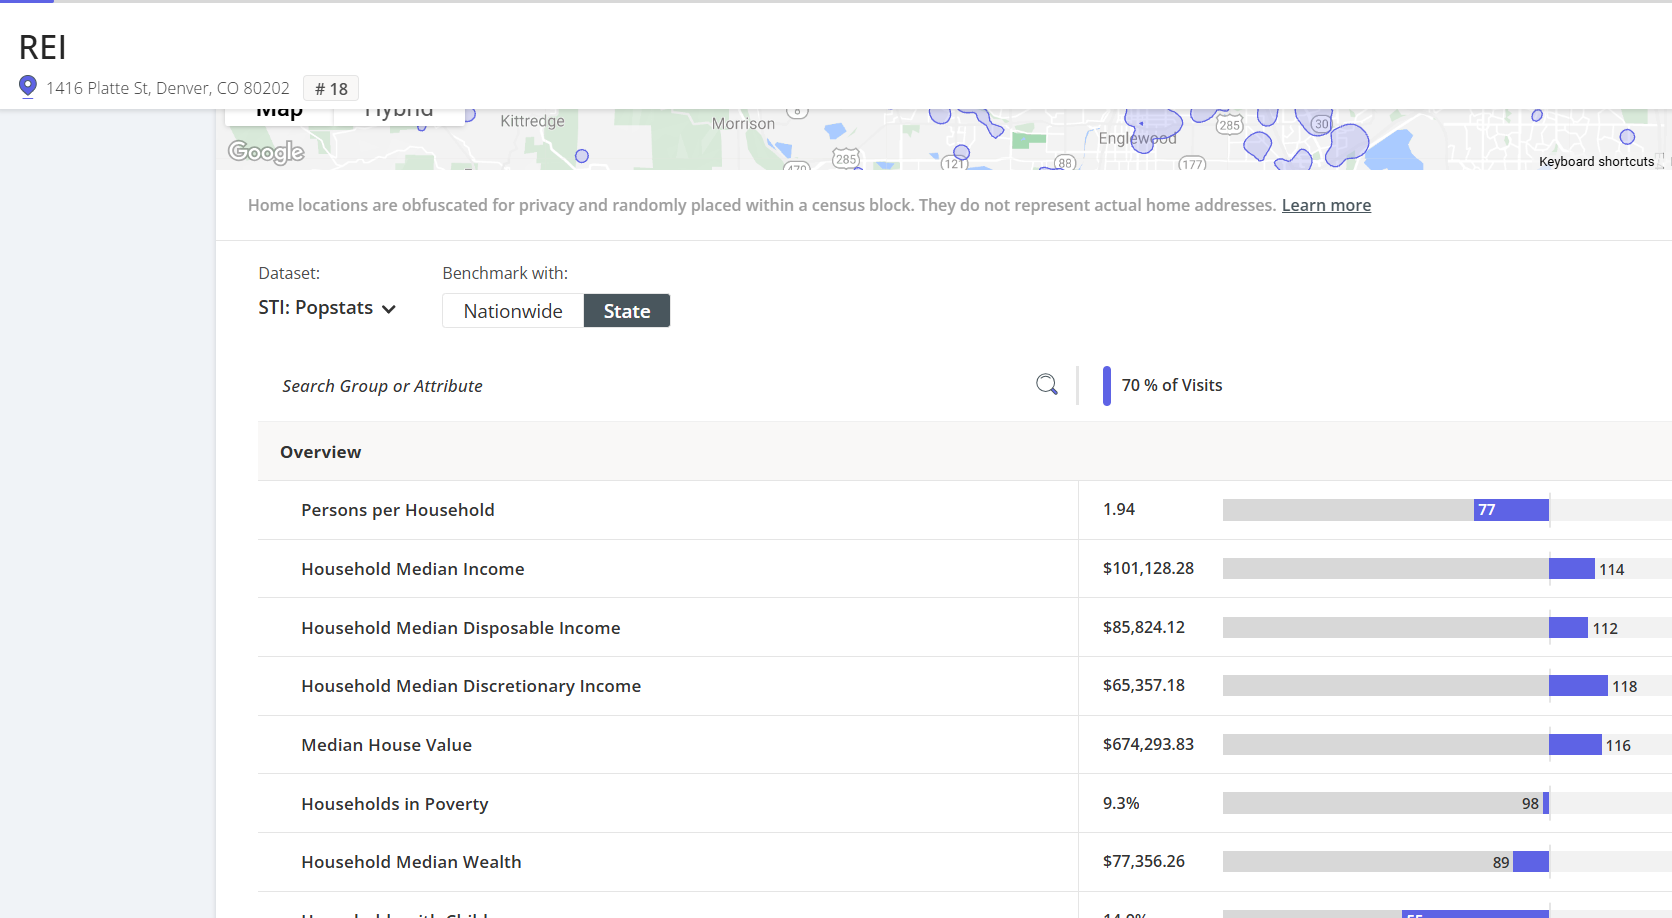
You will see two numbers.
- The percentage represents the percent of your visitors that are that demographic, or you will see whole values as options, depending on the line item.
- The index represents whether your percentage of visitors from that demographic is above or below the percent of that demographic that lives in the state (or the nation if you choose nationwide)
B. To analyze visitor demographics for a group of stores or for your entire chain, go to the Chains tab. Select a chain for your entire chain, or select a Tag for a specific set of stores that you have created.
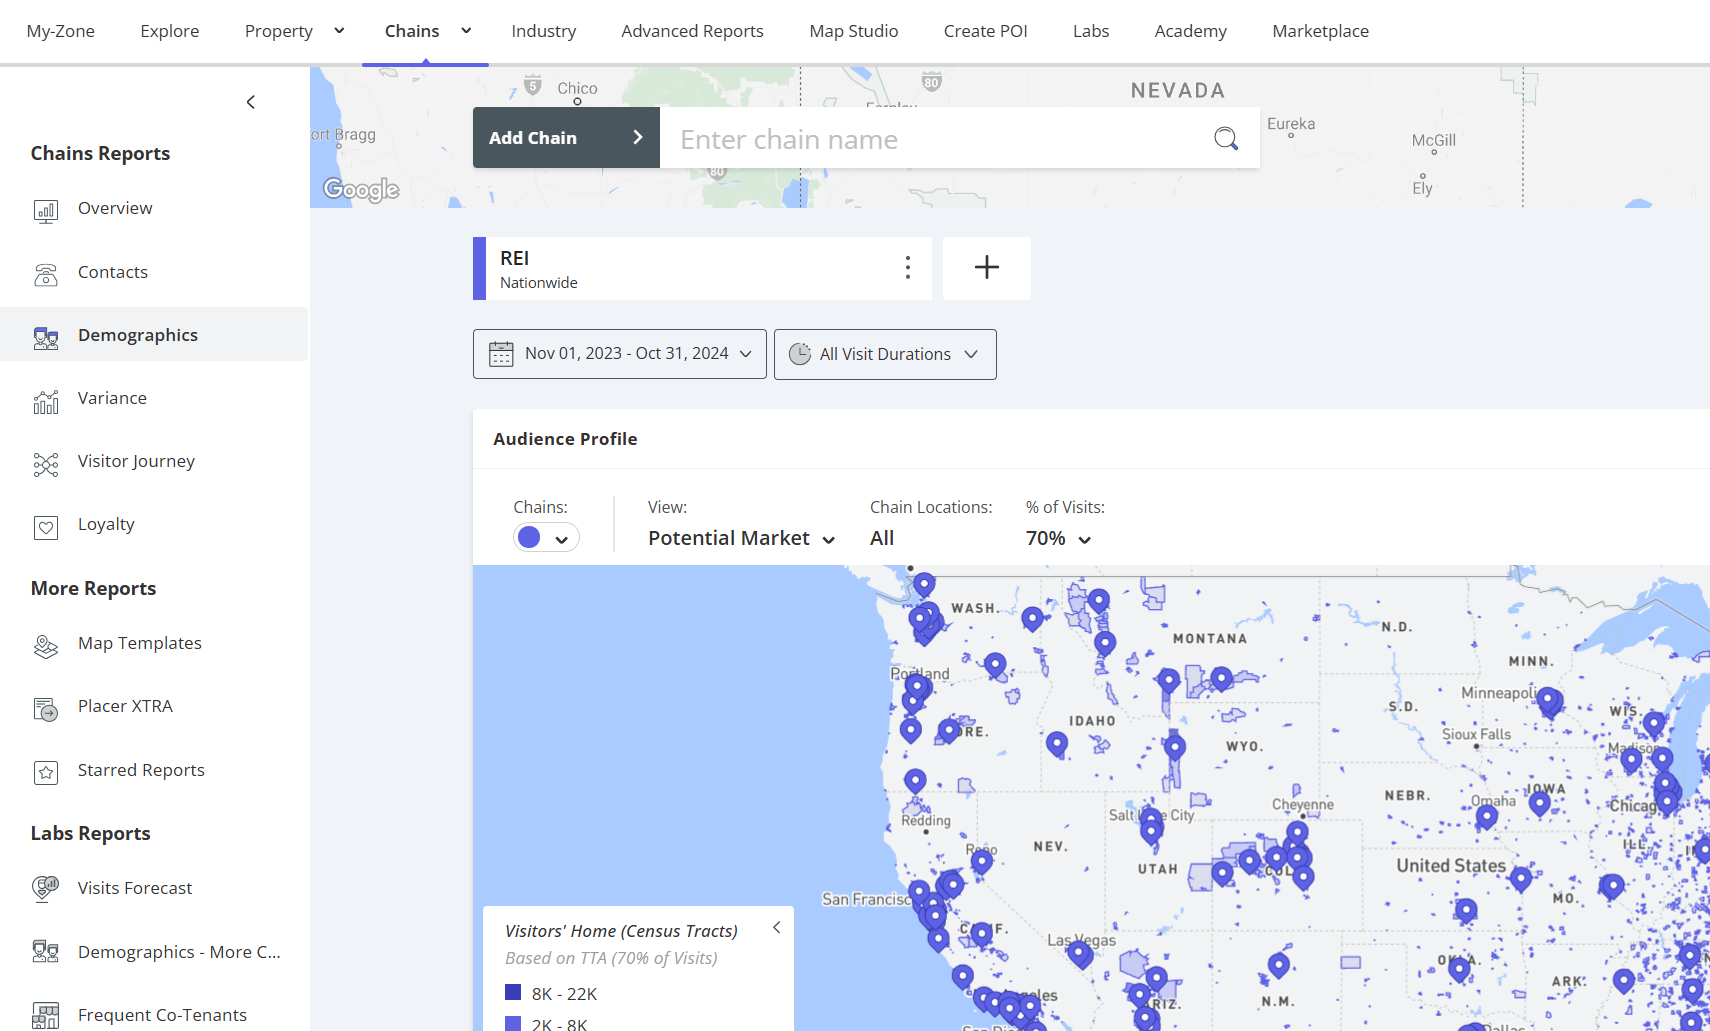
Use the Demographics section as described above.
Note that some datasets or line items are only available for Potential Market.
How to analyze the demographics of your visitors compared to the general population that lives in your trade area
In order to compare your store visitors versus the general population of your trade area, you will need to perform a “Captured vs Potential” analysis.
In the Audience Profile selection, select “Type: Captured vs Potential”
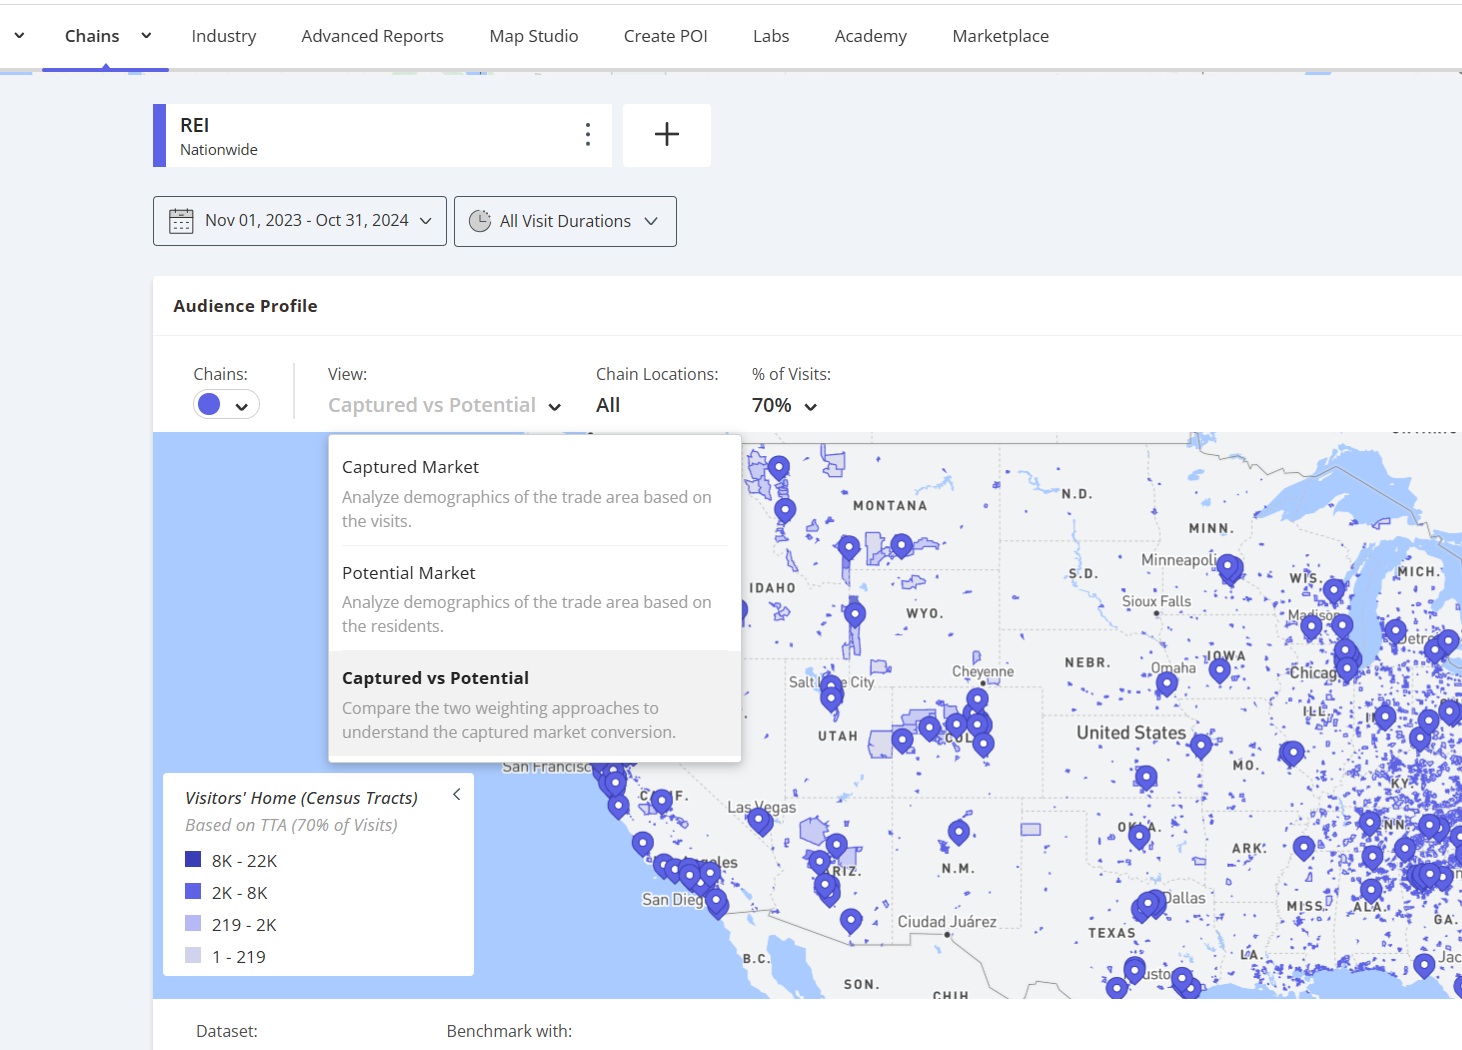
When looking at the numbers, you will see:
- Captured Market: This represents the percentage of your visitors that in this demographic segment
- Potential Market: This represents the percentage of the general population in your chosen trade area that are in this demographic segment
- % Difference: This represents the difference between the two numbers. A negative number means that you are capturing a lower percentage than what lives in the trade area, and a positive number means that you are capturing a higher percentage than what lives in the trade area.
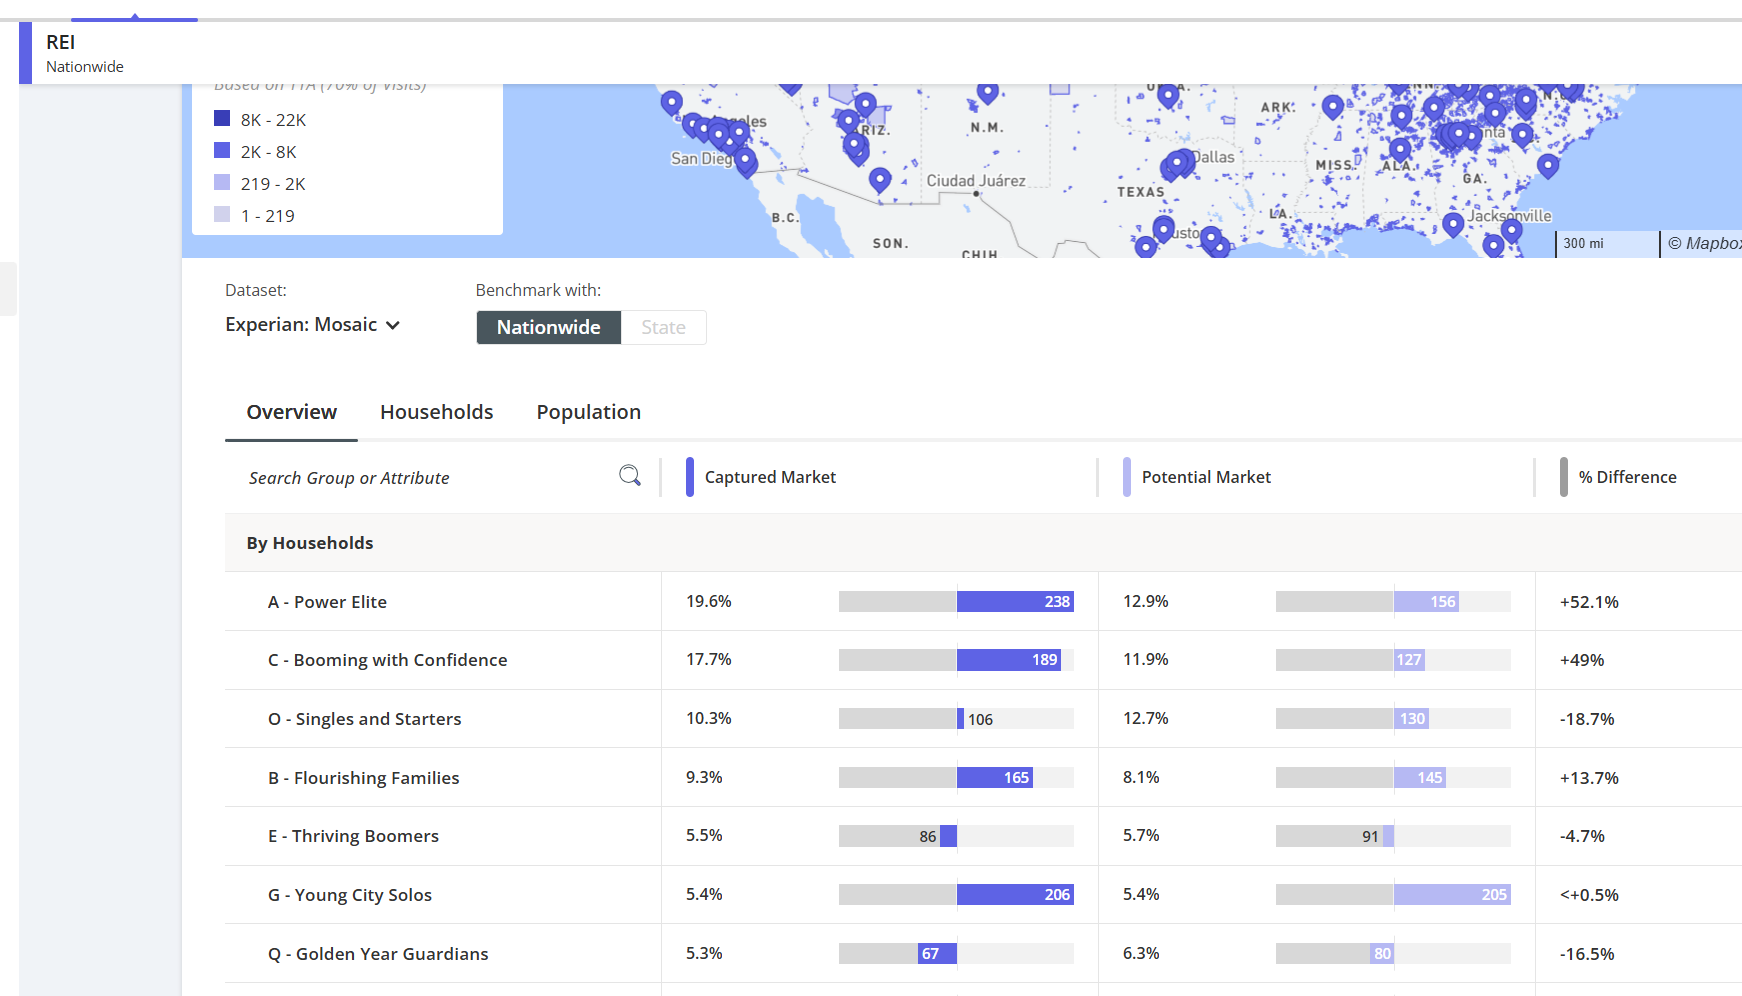
This analysis can be done from the Property as well as the Chains Report.
How to compare demographics against a competitor
In order to compare your demographics versus that of a competitor, all you have to do is add a competitor to the report. Note that you can add up to eight POIs of any type, so if you want to compare two of your stores against each other, you can do that analysis as well.
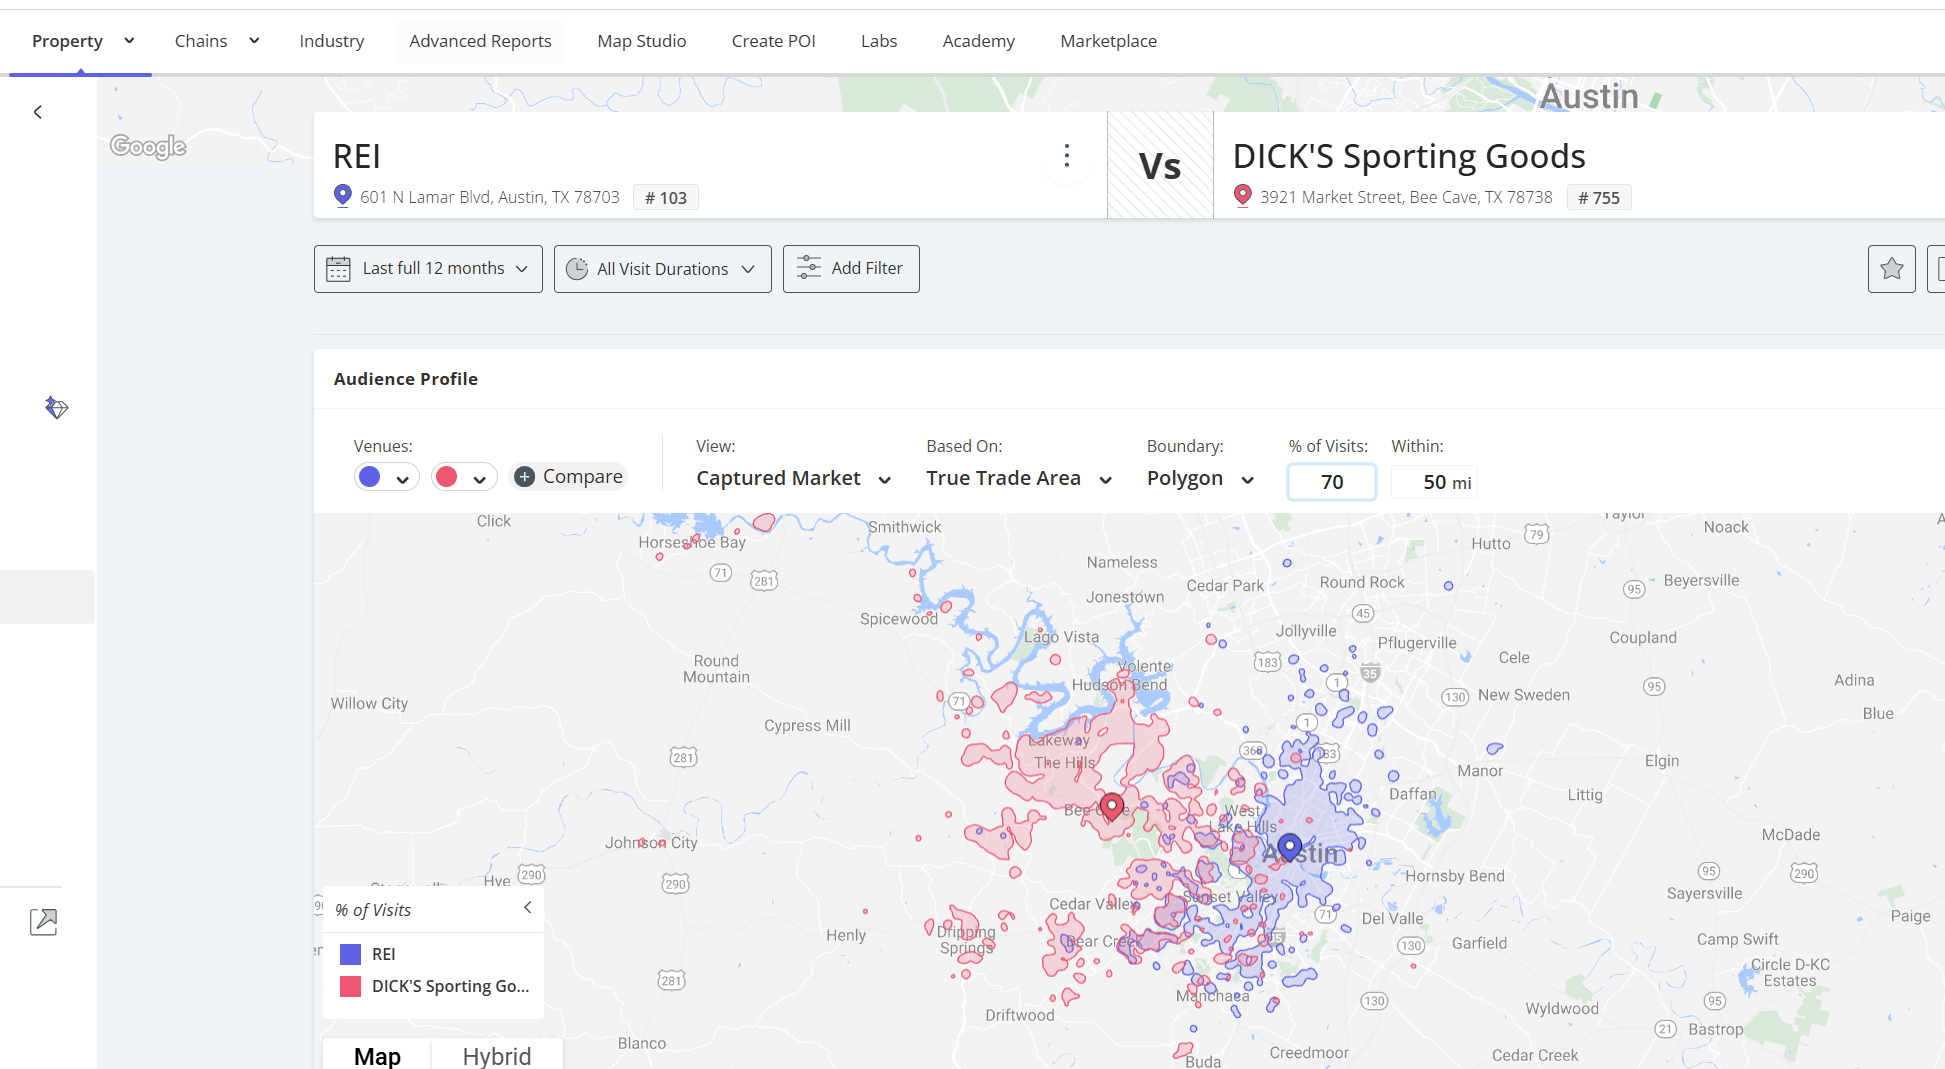
After you have added a second property (don’t forget to hit “Go” when adding additional properties or chains), go to the Audience Profile section and hit the “Compare” button and select the additional properties/chains.
When you scroll down to look at the metrics, you will see the properties or chain demographics presented side by side.

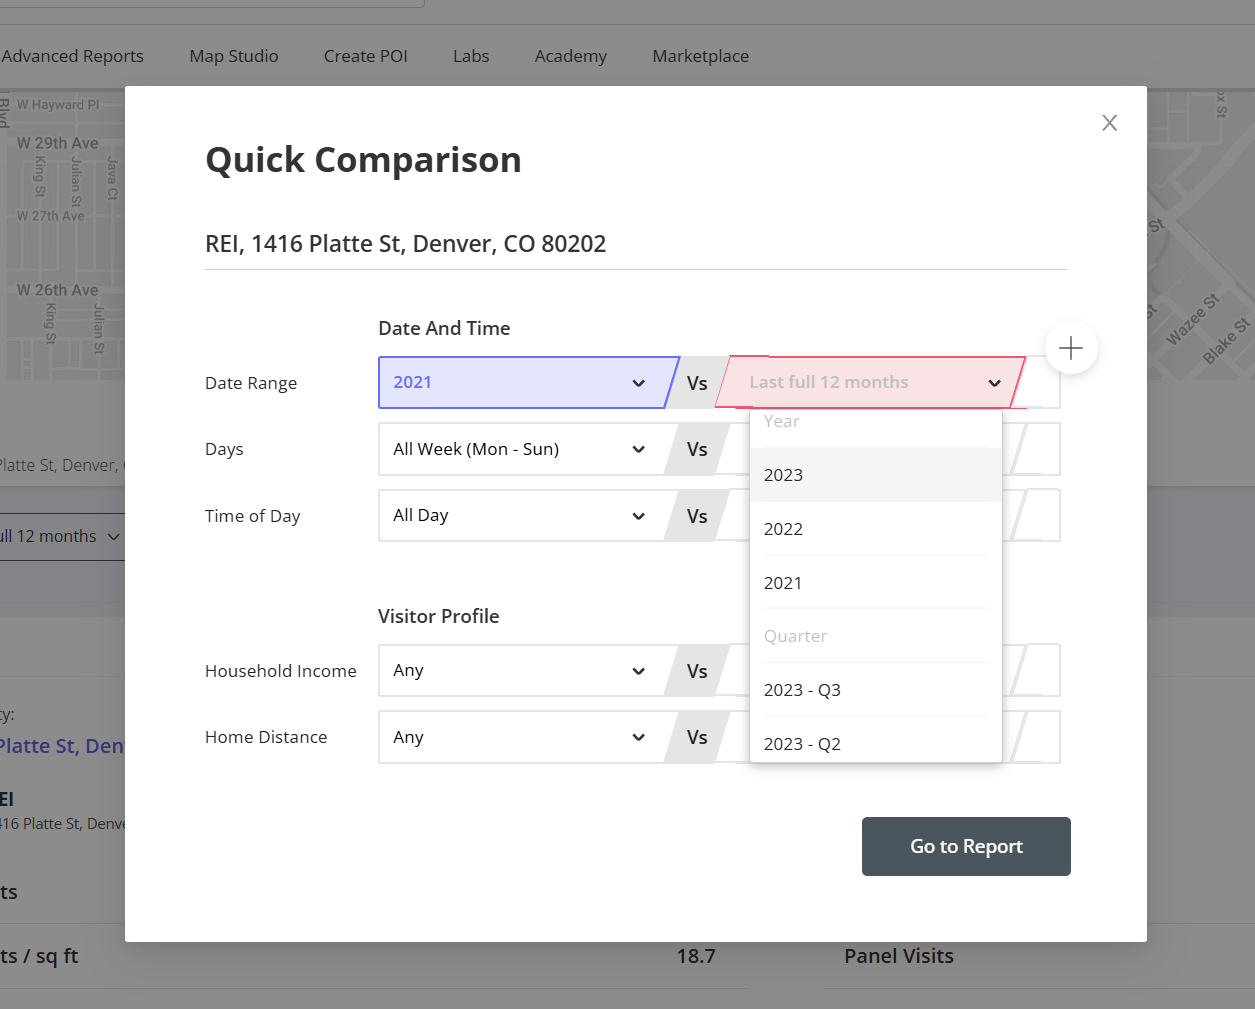
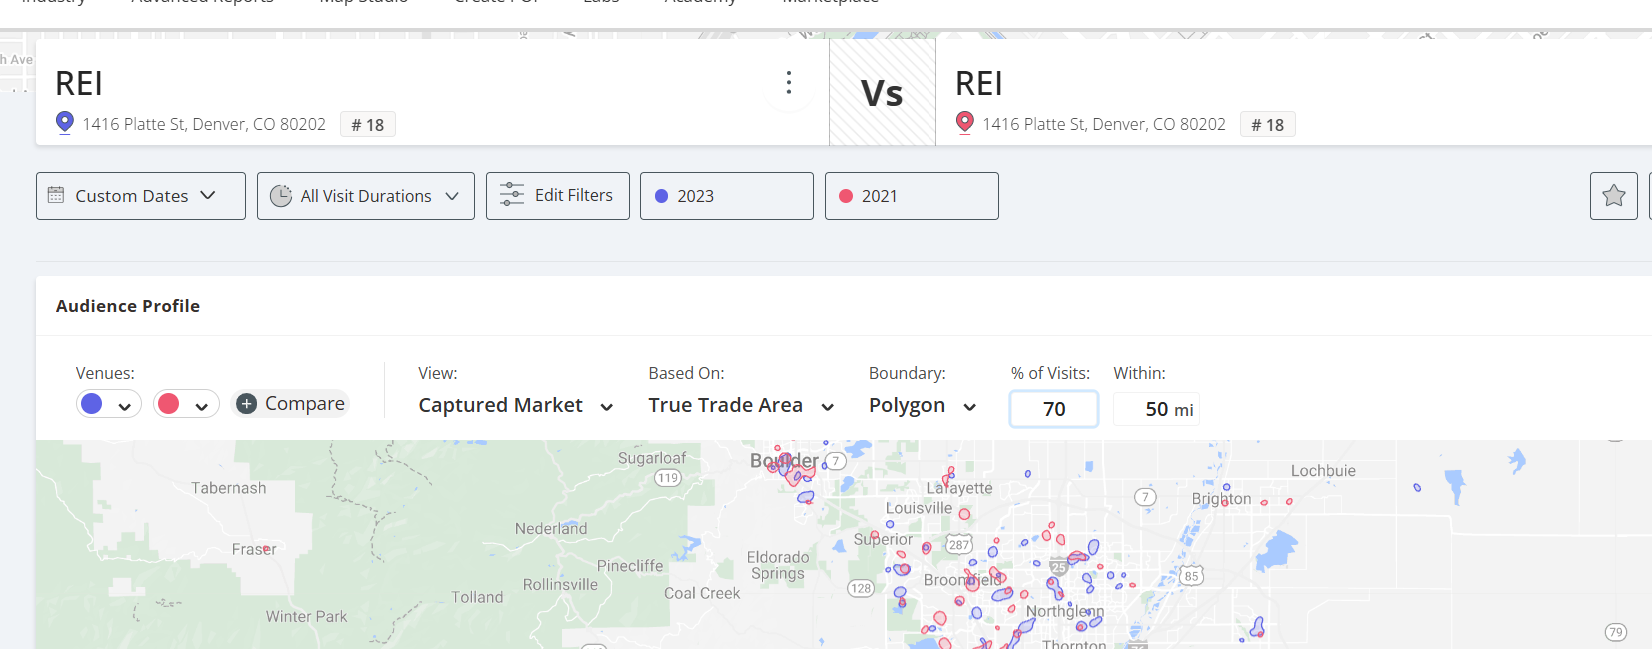
How to compare demographics over time
In order to compare demographics over two different time periods, use the “Quick Compare” feature. To use the Quick Compare feature, click on the three dots in the name tab.

Select two different date ranges and click "Go to Report".
Go to Demographics and view the side-by-side comparison for the time periods.
Conclusion
You should now be able to analyze demographics across single stores, competitors, as well as at the chain or regional level. You can analyze what demographics are coming into your store, what demographics exist in the general population of your trade area, and quickly compare the two to see if there are any missed opportunities.
The Geo-Targeting Planner XTRA and Targeted Search XTRA reports are also great ways of searching by demographics.
Lastly, you can visualize demographics on a map using the demographic layer within Map Studio