
.jpg)
The Events Template is a specially crafted dashboard view tailored for all our civic clients. Please remember, only one custom template can be utilized per account.
To activate the Events Template for your account, simply reach out to your Customer Success Manager.
Once the template is up and running on your dashboard, dive into analyzing your event with these easy steps:
Step 1: Pick the event location and dates
Select the Placer Point of Interest (POI) representing your event location. If it's not previously created, no worries! You can request a Verified POI or create a custom one. Make sure to choose the correct date range for your event. More information on selecting dates available here.
Step 2: Dive into event visit analysis
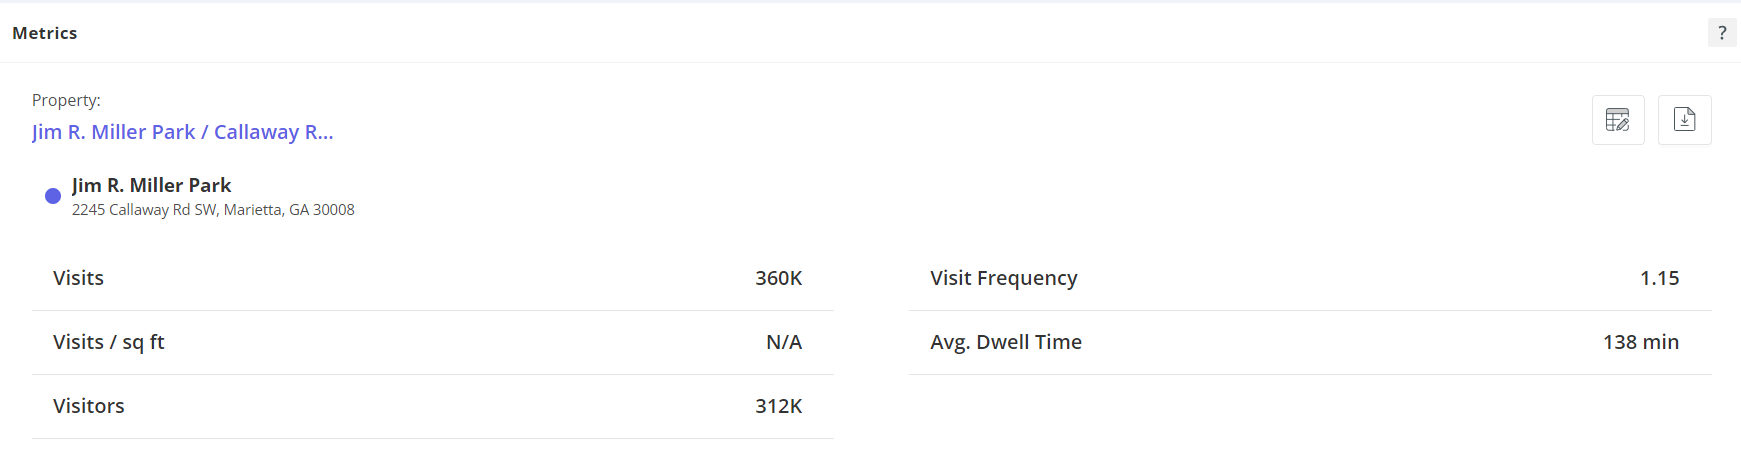
Learn about the number of visits, unique visitors, visit frequency, and average dwell time to understand visitor behavior better.
Visits: How many times people visited your property during the event
Visitors: Singular unique people to the property/event (e.g. If you visited X property 3 times in the last 6 months, you would be counted one time as a visitor and 3 times in visits)
Panel Visits: Total number of panel devices or cell phones tracked to the location during the time period selected (this is a raw data point that most users hide from their view to avoid any confusion)
Visit Frequency: The average number of visits per visitor.
Avg. Dwell Time: The average amount of time spent by a visitor.
Learn about Metrics
Step 3: Explore event trends
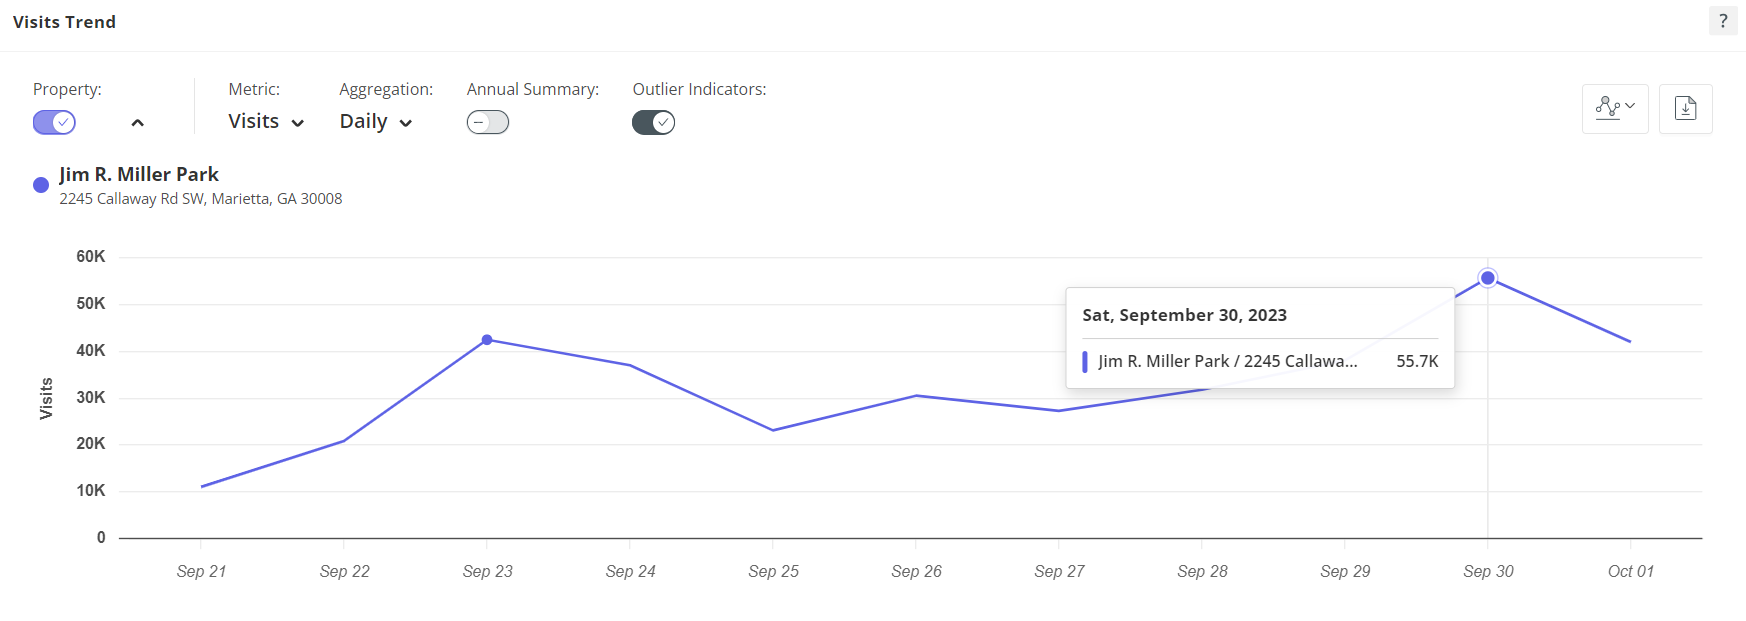
Check out visit trends over time to spot patterns and plan accordingly. This insight helps you understand foot traffic variations, enabling better decision-making.
Visit Trends shows visitation trends over time to the selected property. It usually helps to view a longer time period so you can see spikes in foot traffic versus days with lower foot traffic and apply anecdotal information to the numbers. This view allows us to get a macro view of foot traffic to a location and understand seasonality.
e.g. "I can see a spike on the 4th of July due to the holiday event that was held."
e.g. "We had a farmer’s market on Fridays throughout the summer and we can clearly see the spike in foot traffic at the end of each week."
e.g. "Saturday the30th was the most-visited day for the fair."
Learn about Visits Trends
Step 4: Track traffic routes
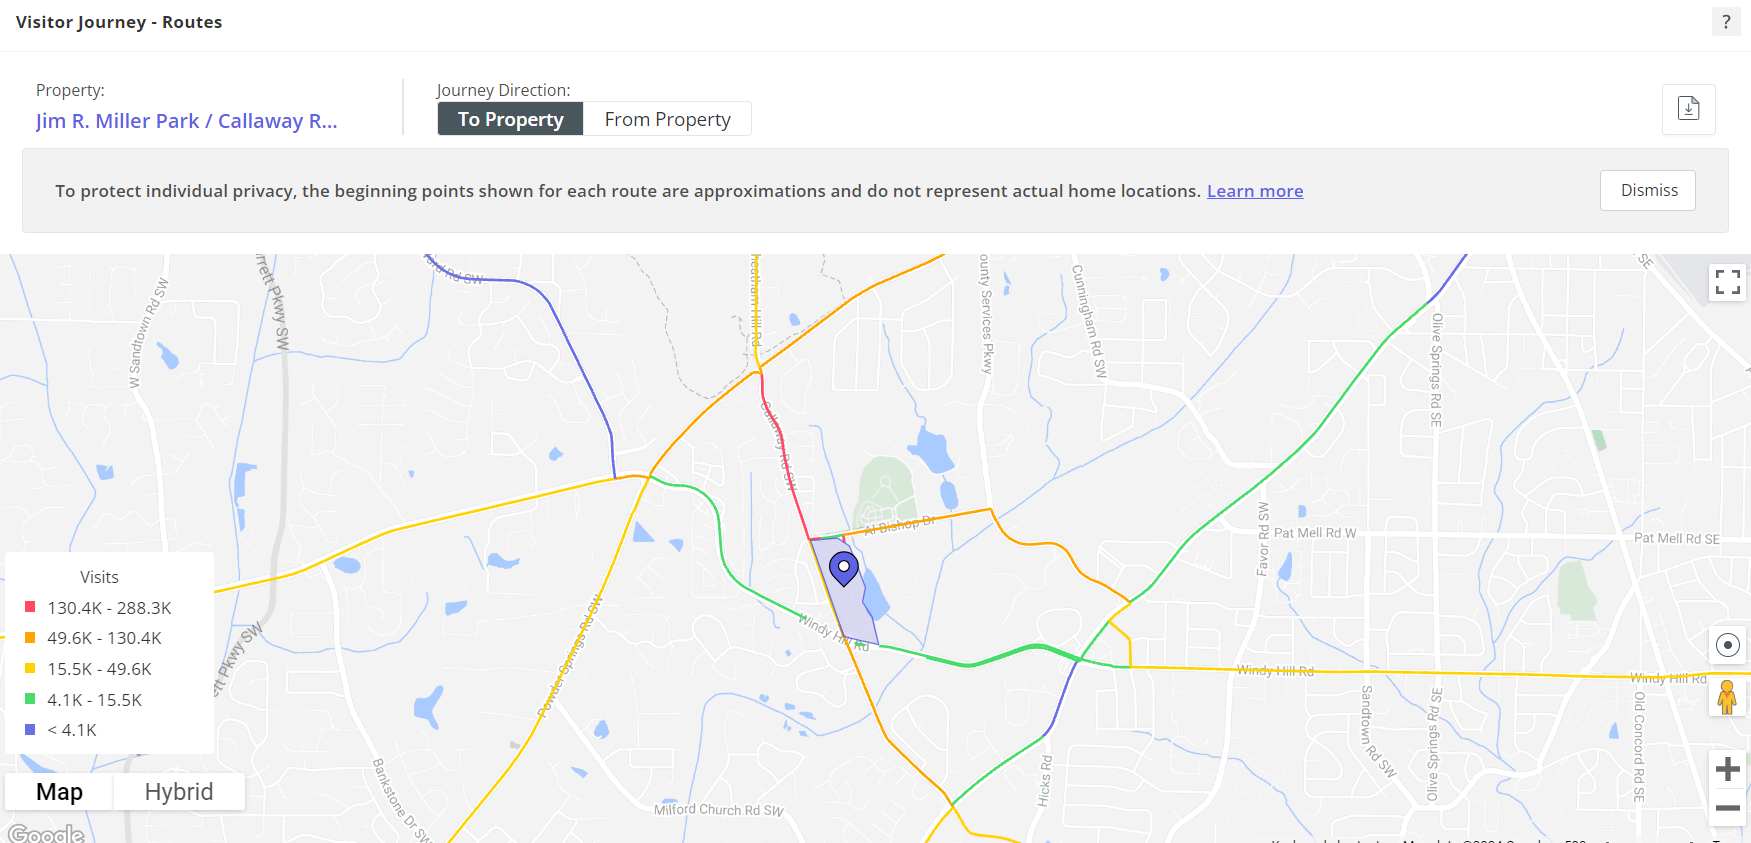
Understand visitor journey routes to and from your event location to optimize traffic flow and signage placement.
Visitor Journey Routes show vehicle traffic routes to and from any property. Uncover the properties and brands that customers go to before and after visiting another property based on their travel paths. This helps us to understand traffic patterns- if we need to add additional parking, when and where there will be congestion, if we should have traffic guards, if roads need to be shut down, etc.
This information is also valuable for signage or billboard placement for maximum views as attendees approach the event site.
Learn about Routes
Step 5: Discover visitors' journey
Explore the locations visitors frequent before and after attending your event.
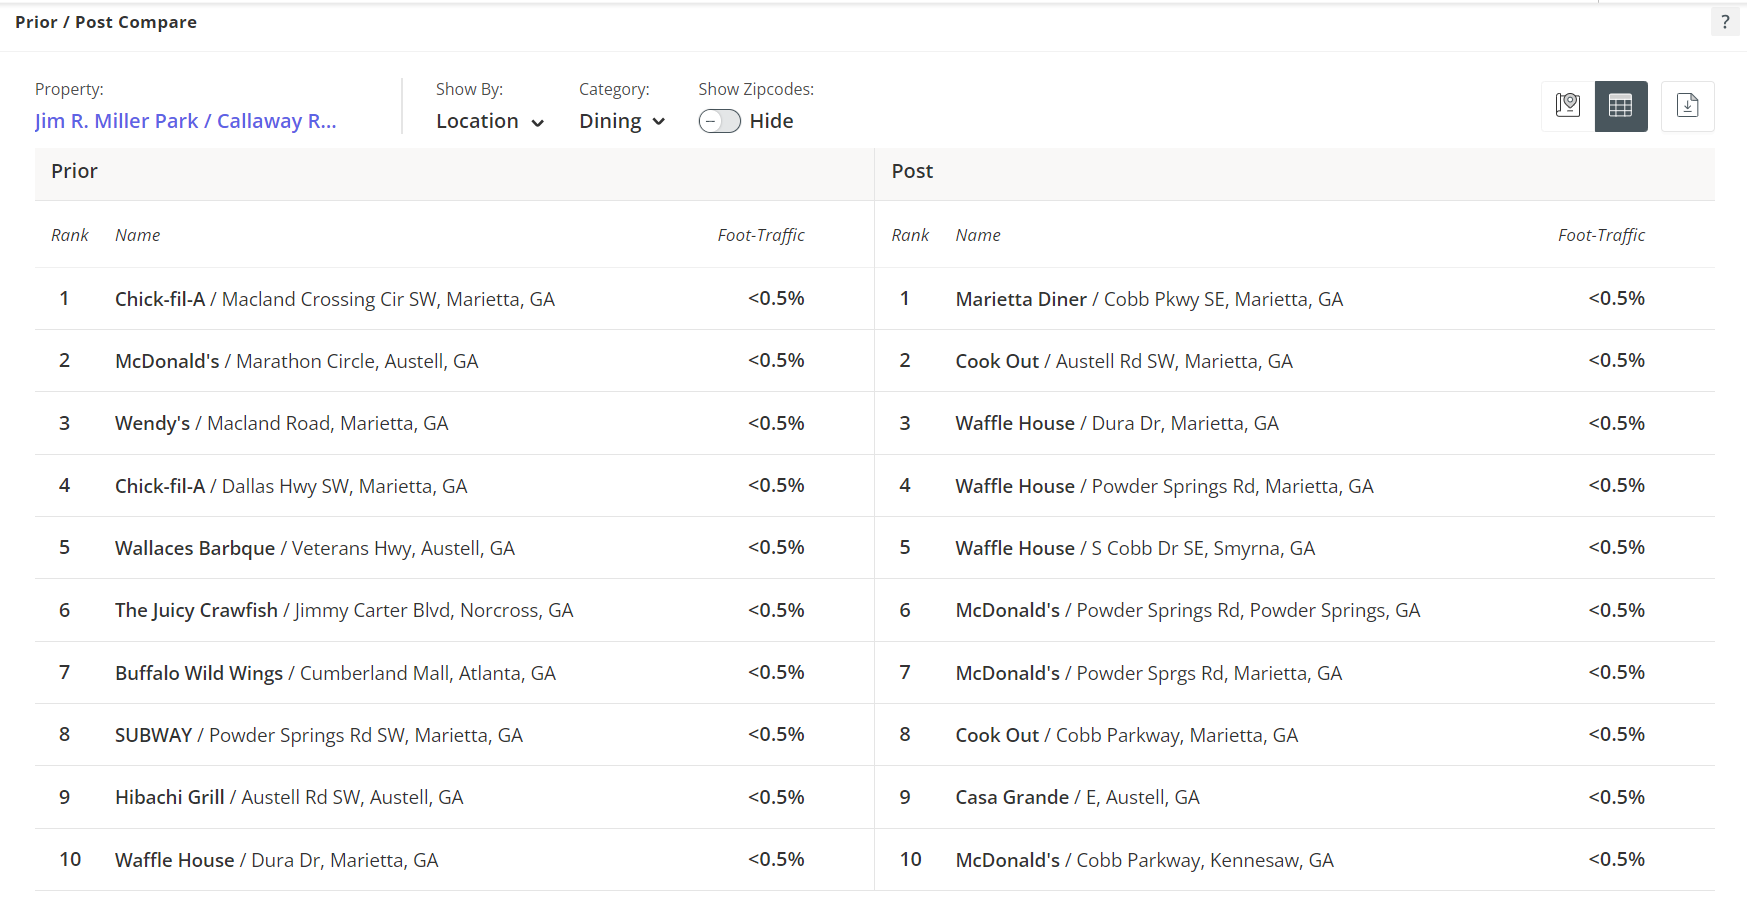
Prior and Post Comparison enables you to see the other locations that visitors frequent before and after going to a single location.
Teams use this for:
a. Retail attraction & smarter event planning: e.g. if sit down restaurants are frequented before & after an event, perhaps the team should attract another sit down restaurant option vs a fast/casual. You can also determine cuisine and price point preferences for your event attendees.
b. Grants and sponsorships: "these locations are getting high visits from our event, they might consider sponsoring us, donating, or becoming a vendor.
c. Bolstering small businesses in area: "show proof that you attended our event/restaurant and get 10% of your purchase or ticket" - you can track the cross-visitation, or persuade uncertain small business partners
Learn about Prior/Post Compare
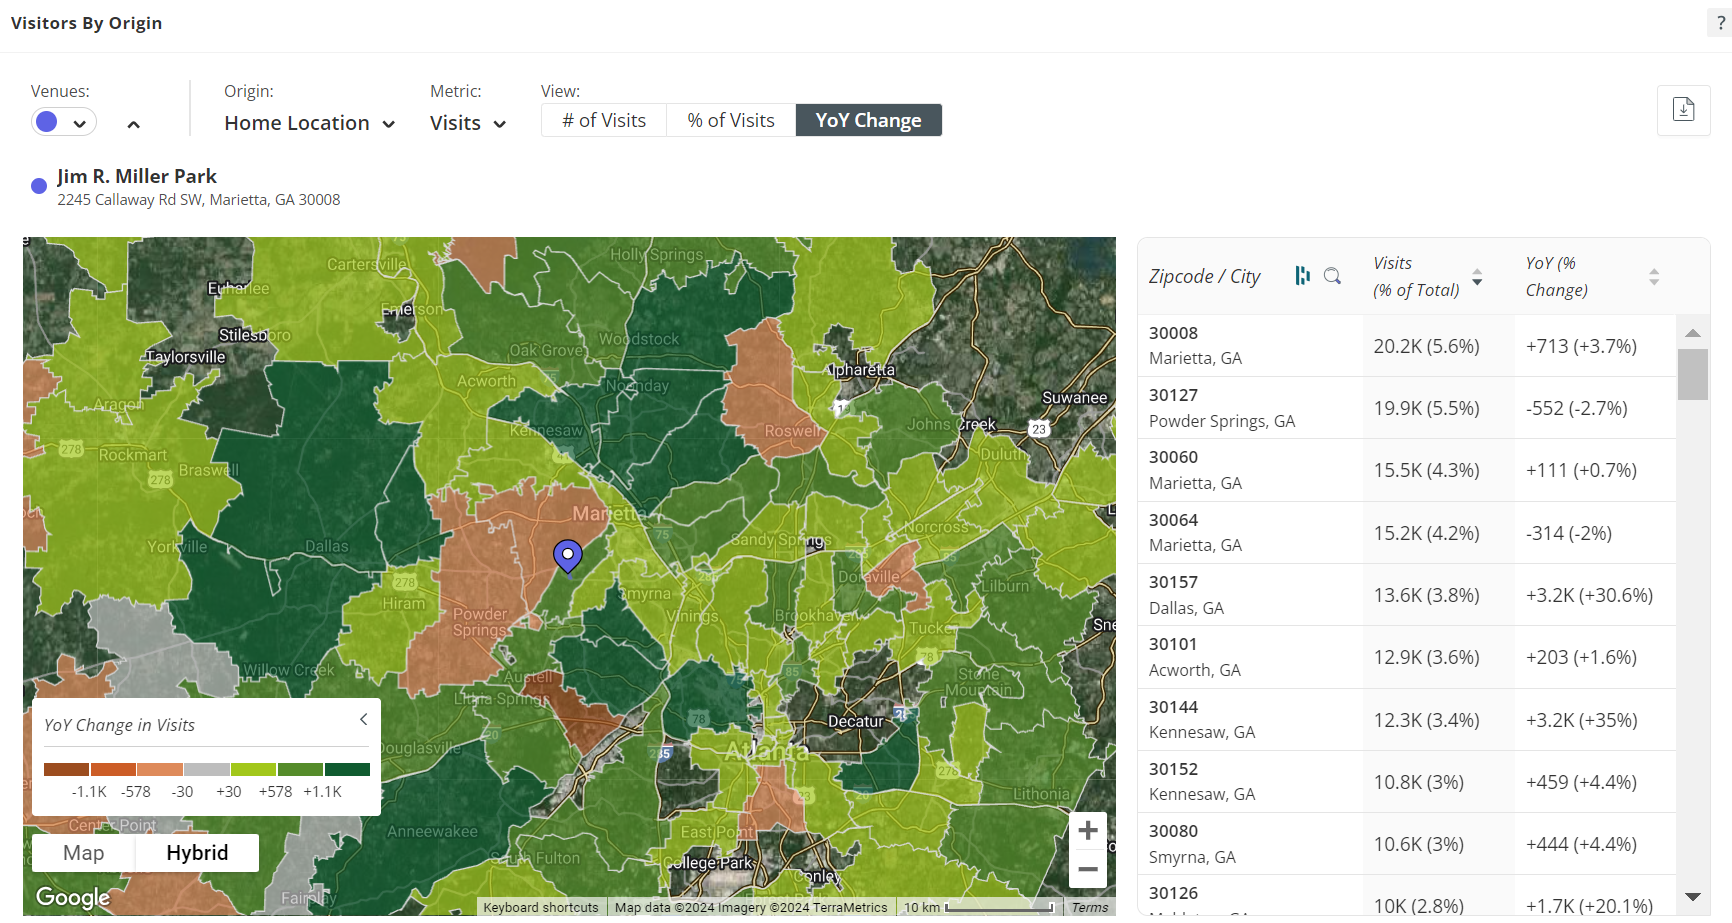
Step 6: Know your attendees' origins
Identify the zip codes where your event attendees live or work to refine your marketing and outreach strategies.
Visitors by origin: Shows the home or work zip codes that generate visits to your location/event.
Use this to see where people in your event's trade area work or live. This is an simple way to see what areas or zip codes could use additional marketing, outreach, advertising.
e.g. "we have no visitors coming from this zip code, let’s appeal to them with ads" OR "we have a lot of visitation here, let’s double down" OR "we have lost visits in this zip code compared to last year -why?"
Teams also use this view before and after zip code targeting to measure effectiveness of those ads -i.e. did they actually increase visits from that zip?
Learn about Visitors by Origin
Step 7: Understand demographics of your event attendees
Learn about the household income and ethnicity of your event attendees to tailor your offerings effectively.
Household Income presents the average and median household income levels of visitors using several income range groups. The data displayed in Household Income pertains to visitors by their home origin and leverages Census 2021 data aggregated at the Census Block Group level. Use this to identify the income of your visitors to events.
Ethnicity provides a breakdown of the ethnic groups that characterize a property's audience based on data provided by Census 2021. The data reflects the population in the property's Captured Market and therefore, emphasizes the attributes of visitors. Use this to identify the ethnicity of your visitors to events, to understand your overall population and plan accordingly.

Learn about Household Income
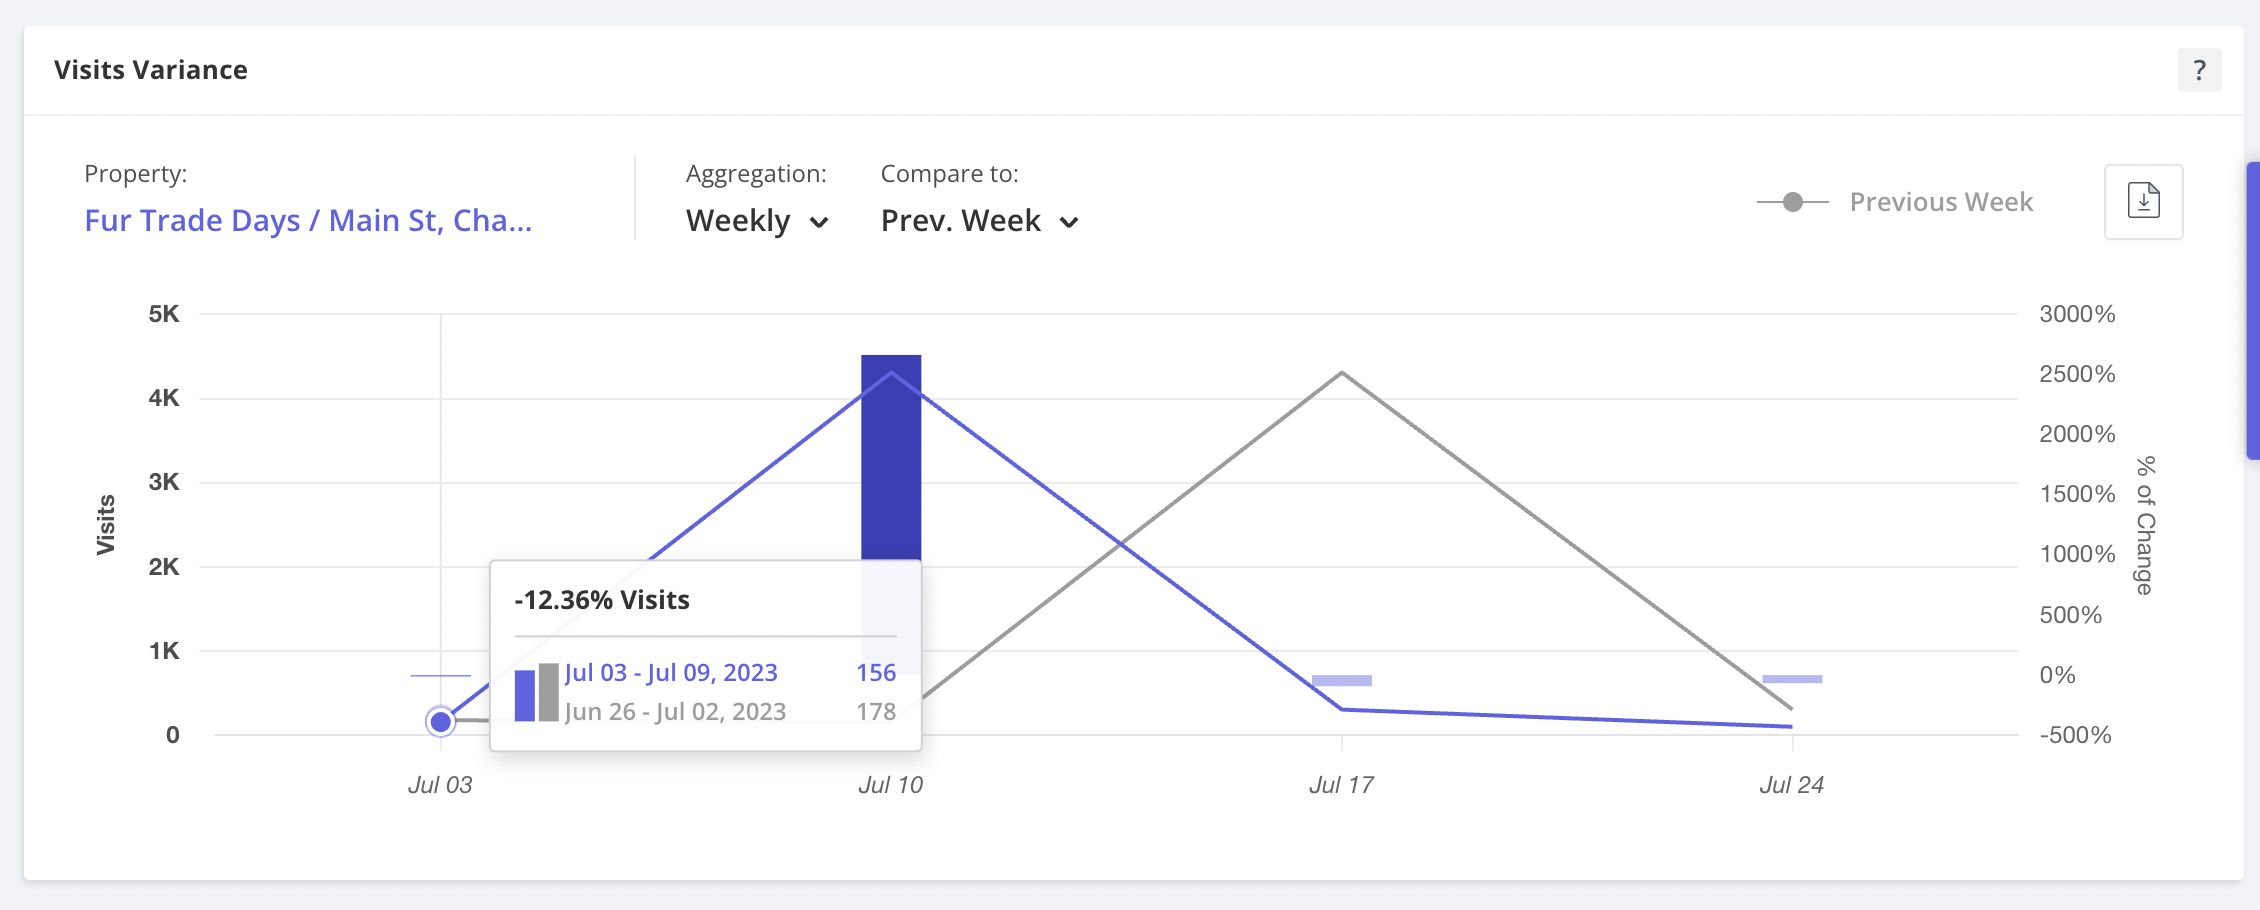
Step 8: Review event visitation trends
Monitor changes in visitation over time to gauge the success of your events.
Visits Variance shows the change in visitation for a single location over the selected date range. Use this for looking at repeat events such as a farmer’s market or summer concert series to see how your event is doing week over week, month over month, or year over year. (You can also use Quick Compare to compare the same location but with changing custom dates.)
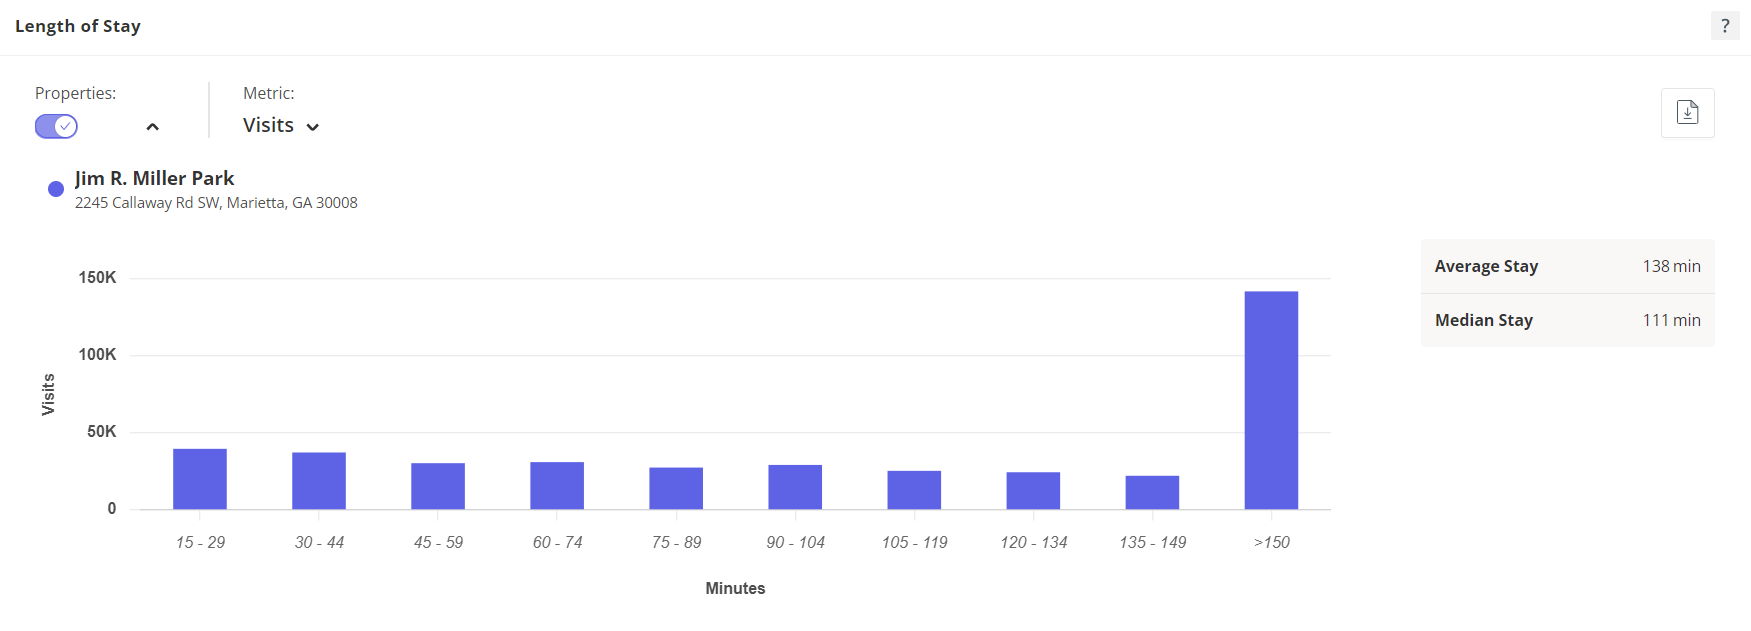
Step 9: Analyze dwell time & busy times
Understand how long visitors stay and peak visitation times to optimize staffing and promotions.
Length of stay indicates the amount of time, in minutes, that a visitor spends at a location.
Hourly Visits shows the total number of visits to a property at any time of day during the selected date range; this is helpful for events to analyze peak levels of visitation, staffing levels, and planning for future events. This can also help small businesses to understand when a business should be open and has the potential to garner more traffic, and enabling promotions/discounts/marketing based on hours that there is less traffic to promote more visitation.
Learn about Length of Stay

Learn about Hourly Visits
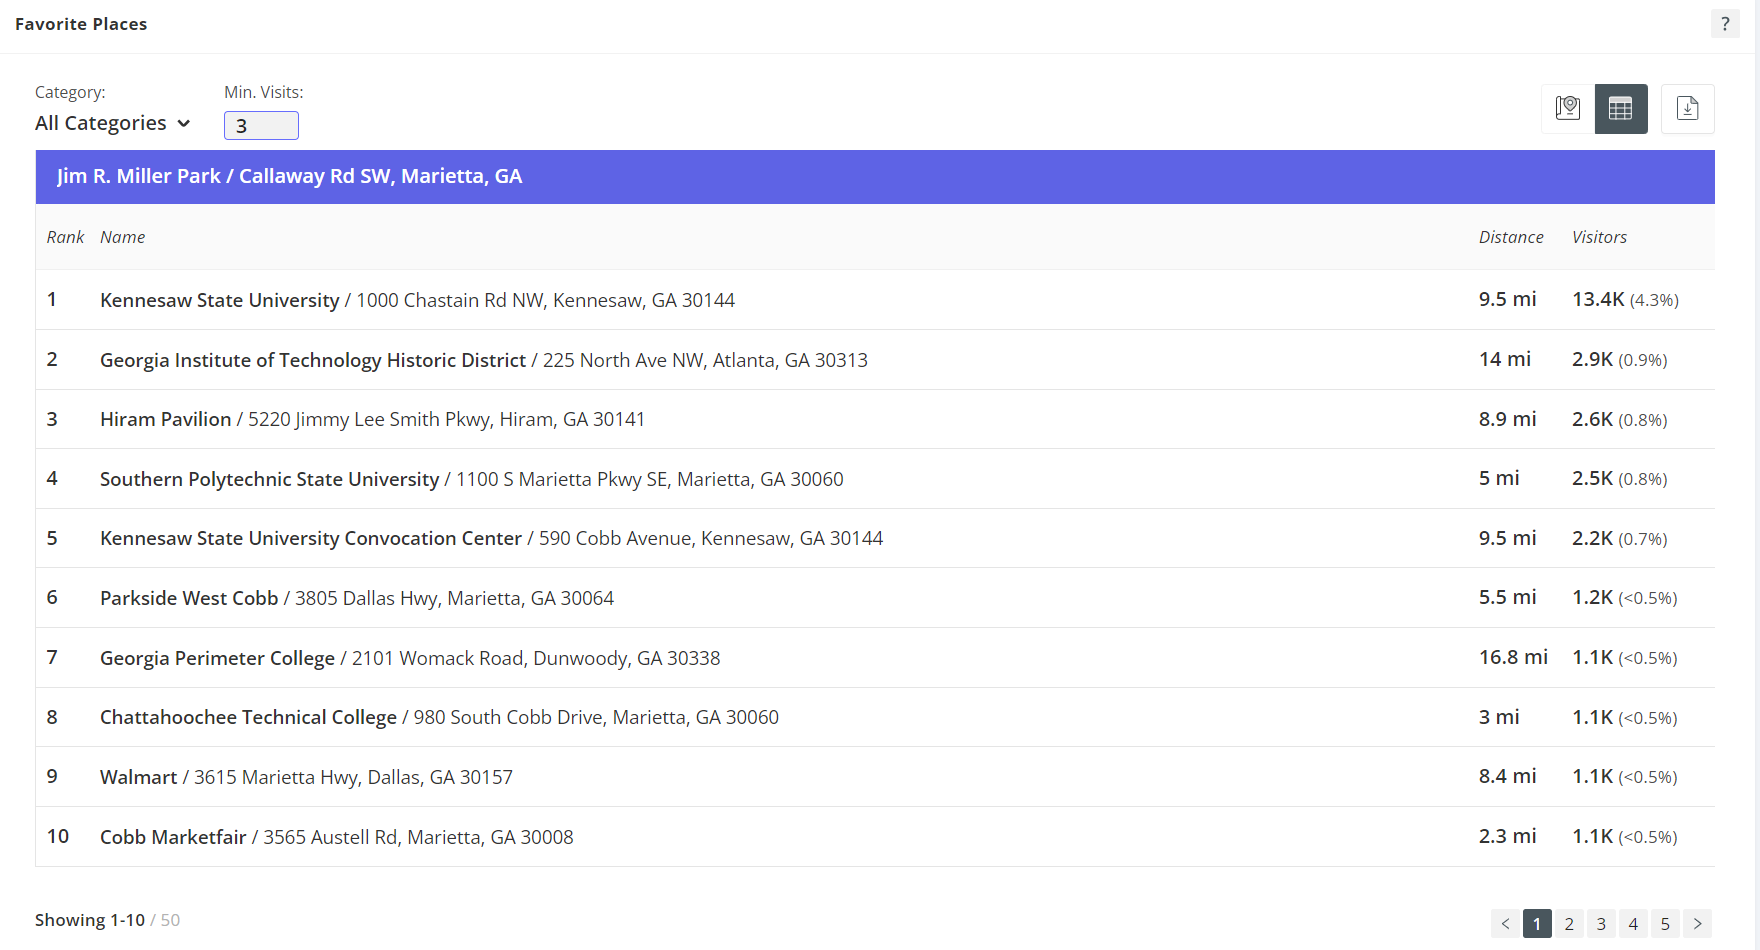
Step 10: Note your attendees' favorite spots & preferences
Discover other local places visited by your attendees to enhance retail recruitment and visitor experience.
Favorite Places provides a list of other local places that visitors to a certain location have also visited during the selected time frame (i.e., "X% of visitors to my property also visited 'property Y' during the last X months") Similar use cases to visitor journey- see visitor journey section above.
Note that this is not showing a direct route. Seeing mileage is helpful to understand just how far people are going to get to a specific location which is helpful for retail recruitment. We can also see how many times they are visiting a specific location.
Learn about Favorite Places
Step 11: Event insights at the Market level
Pro Tip: The reports and widgets available in the Markets section may vary per account.
Understanding event activity in your market is essential for anticipating impacts on traffic flow, economic activity, and public safety. Placer’s Event Insights at the market level help you see when and where various events take place in your market and gather insights on the potential impact on your community.
To explore event activity, go to the Markets section, enter your market of interest, and click on Events in the left-hand sidebar. You’ll see an overview of events happening in the area during your selected date range.
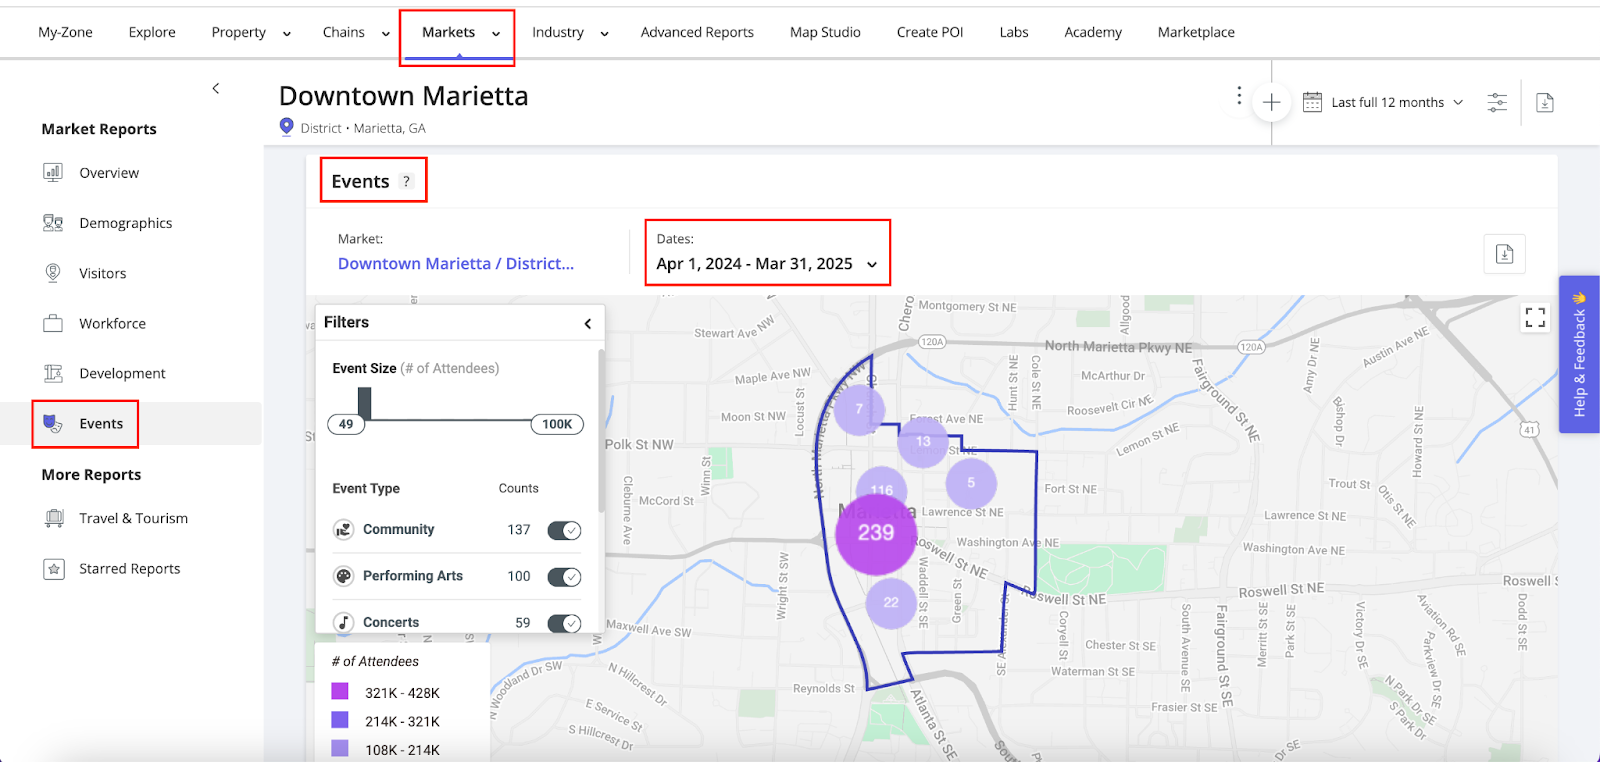
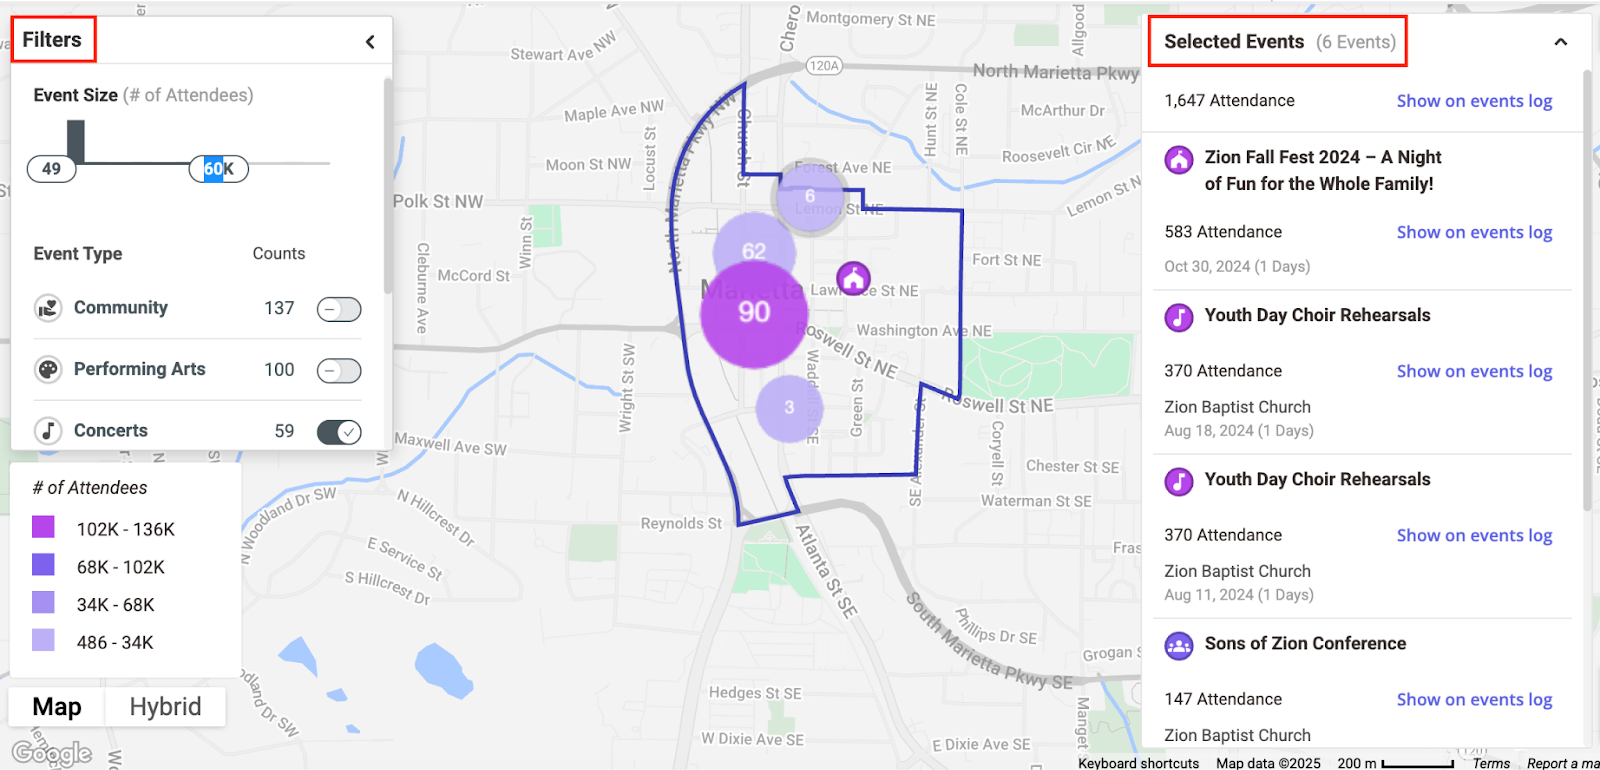
In the map view, events are grouped by proximity to highlight areas in your market with the highest concentration, and pins are color-coded based on the number of attendees. Clicking on a pin will reveal additional details about the selected event.
You can also apply filters to focus on certain event types or attendee ranges, making it easy to identify the most relevant events for your planning needs.
Remember, if you want to delve deeper, we have an on-demand webinar available on this topic. - visit here any time.
Let's make your event analysis a breeze with the Events Template. Happy analyzing!