
.jpg)
Store closings can significantly affect visitation and draw. With Placer, analyze and compare data prior to and after a store closing, while considering different metrics such as visits, rankings, and average incomes.
You’ll be able to answer these questions after reading this article:
- How has foot traffic to your location changed since the store closed?
- Has the closure increased visits to similar businesses outside of your chain?
- How does your store perform compared to your competition since the store’s closure?
Get started with the following steps:
Step 1: Use the Quick Compare Function to see data before and after the closing of interest
This feature allows you to view the same POIPoint (Location) of Interest. side-by-side, with different filters in place. In this example, a CVS pharmacy that closed on April 1, 2022 is used to analyze how that closure impacted the nearest CVS.
a. Open the Placer report for your POI, navigate to the three dots in the POI header bar, and click Quick Comparison. Click Go to Report before adjusting any filters - this will open the same POI side-by-side.
.jpg)
.jpg)
Learn about Quick Comparison
b. From your new report view, click Add Filter. Choose Filter per Venue on the right, and then choose the custom range dates you want to use. For example, since this CVS closed on April 1st, we use 3 months before the closing date, and 3 months after the closing date. Highlight the custom range dates and click Apply. Choose Apply again at the bottom of the section.
c. Now you have a simple view of this POI before and after the store closed. After the store closed, you can see that Visits increased slightly (Metrics), visitors’ loyalty increased - fewer distinct visitors but longer and more frequent stays (Metrics) - and the store was ranked higher (Ranking Overview).
.jpg)
.jpg)
d. Click on Trade AreaRepresentation of the dispersion of home and work locations that drive traffic to any venue. in the left sidebar. Scroll down to Trade Area Overlap and you’ll see that the closing led to a slightly smaller trade area for the remaining store (Total Trade Area).
.jpg)
Learn about Trade Area
Note: you can perform a similar search for nearby POIs (nearby cities, other shopping districts, etc.) to gauge how they were impacted since the store closed.
Pro Tip: use Placer’s Advanced Brand Dominance tools for additional insights. Placer’s Brand Dominance is a raw data feed of foot traffic and rankings on the most popular premium retail chains in the U.S. It’s used to break down the performance of brands by visits and across industry categories. The data feed and Tableau interface are updated monthly. For more information on Brand Dominance or to request pricing information, click here.
Step 2: Request a Placer XTRA Store Closure Impact report
The Store Closure Impact report provides valuable insights when doing a retrospective to see the impact of a store's closure on surrounding stores. You will be able to see how many visitors have remained loyal to the chain, have started being chain non-loyal, or have churned and only shop at alternative chains now. Additionally, you'll be able to see the lost trade area and more.
a. Navigate to the Advanced Reports page and click on Placer XTRA in the left sidebar. Search for Store Closure Impact and click on it. Alternatively, go directly to the report's page by clicking here.
b. Follow the steps in the report's description (under "How Does It Work?") to fill out the request form.
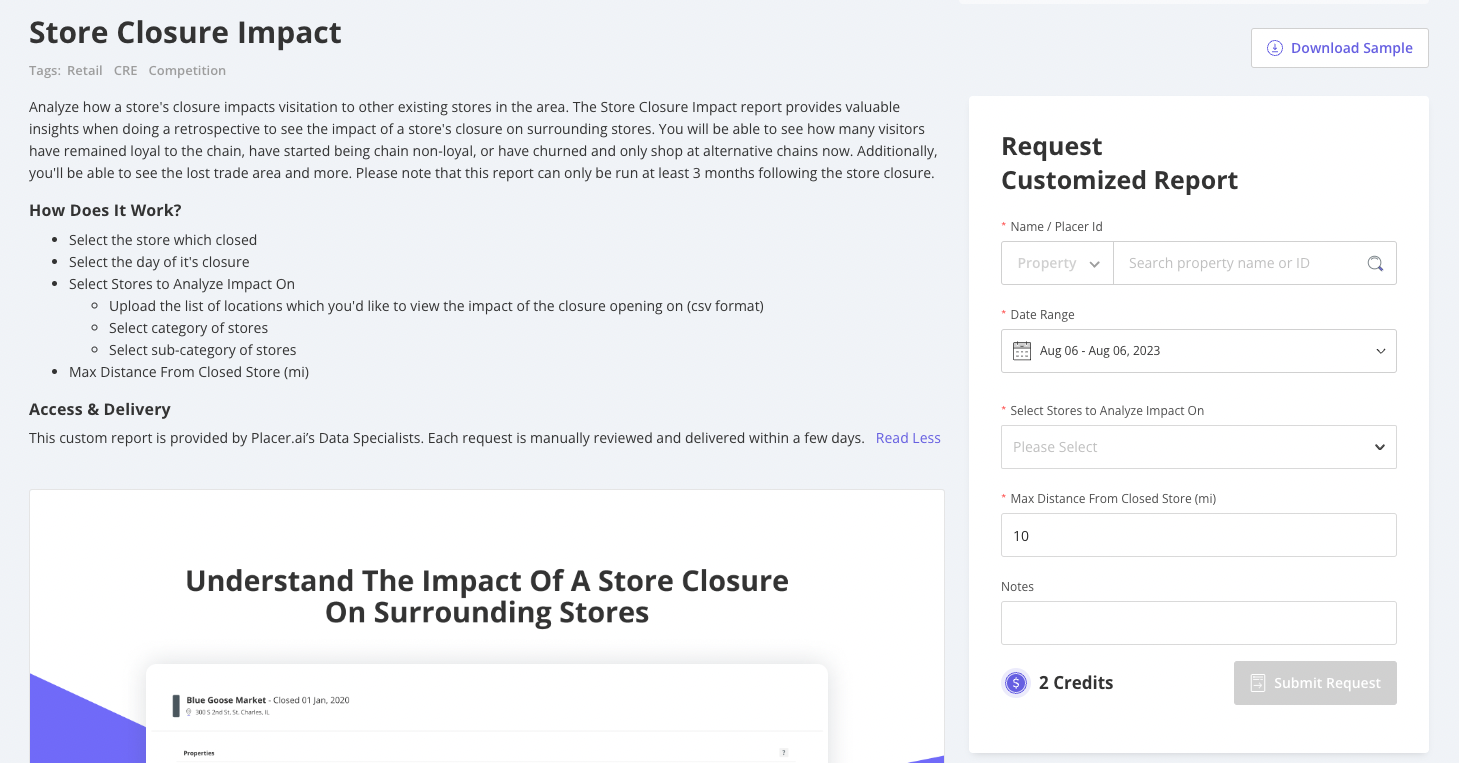
Please note that this report can only be run at least 3 months following the store closure.
c. When the form is complete, click Submit Request. This report has a 4-7 business day turnaround time. When complete, an interactive Tableau report will be sent directly to the requester.
.jpg)